
Figure 8.
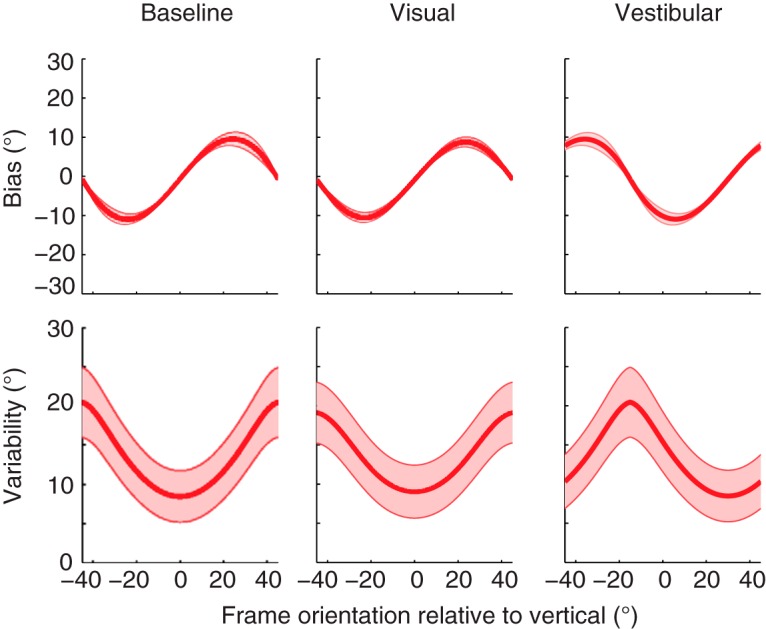
Simulations of the Bayesian optimal integration model for bias and response variability in patients with complete vestibular function loss. Shaded areas represent the SE on the model simulations.
Official websites use .gov
A
.gov website belongs to an official
government organization in the United States.
Secure .gov websites use HTTPS
A lock (
) or https:// means you've safely
connected to the .gov website. Share sensitive
information only on official, secure websites.
Simulations of the Bayesian optimal integration model for bias and response variability in patients with complete vestibular function loss. Shaded areas represent the SE on the model simulations.