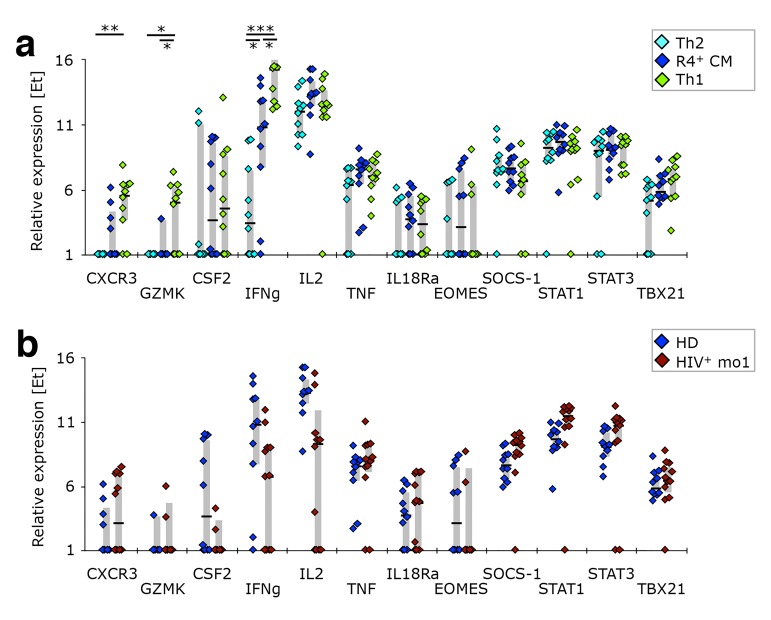
Supplementary Figure 5.
CCR4+ TCM resemble Th2-like cells in respect to their expression of Th1 associated genes. PBMC from healthy donors, as well as cells isolated before or after 1 or 12 months of ART from HIV-1-infected adults were stained with the “sorting” panel (Supplementary Table 1). Subsets of CD4+ T cells were sorted as indicated in Supplementary Figure 4 and their gene expression profiles determined by multi-parametric quantitative RT-PCR. (A) Th1-associated genes were compared in Th2-like, CCR4+ TCM, and Th1-like cells isolated from healthy donors. (B) CCR4+ TCM from HIV-1+ patients after 1 month of ART were compared to their counterparts from healthy donors in respect to expression of Th1-associated genes. Bar graphs show interquartile ranges, median bars, as well as individual data points. Statistically significant differences are indicated: * P < 0.01, ** P < 0.001, *** P < 0.0001.

