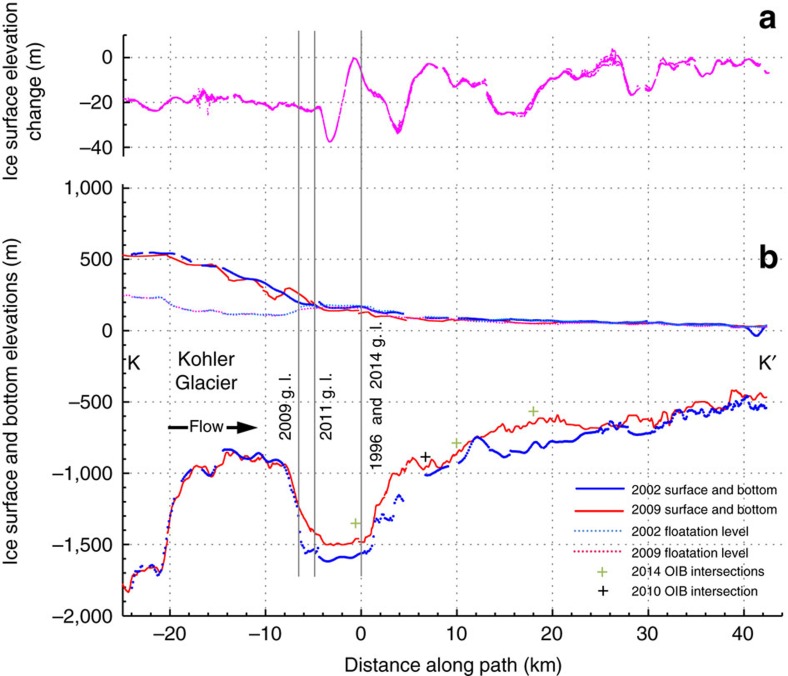
Figure 4. Kohler Glacier radar transects showing basal ice losses and corresponding surface elevation changes between the years 2002 and 2009.
(a) Surface elevation change between 2002 and 2009 as measured by ATM laser altimetry on the along-flow Kohler Glacier (KG) transect delimited by K-K′ shown in Fig. 1a. (b) The 2002 and 2009 ice surface and bottom MCoRDS profiles of KG along the transect delimited by K-K′ in Fig. 1a. The hydrostatic floatation levels were found as described in the caption of Fig. 2b.

