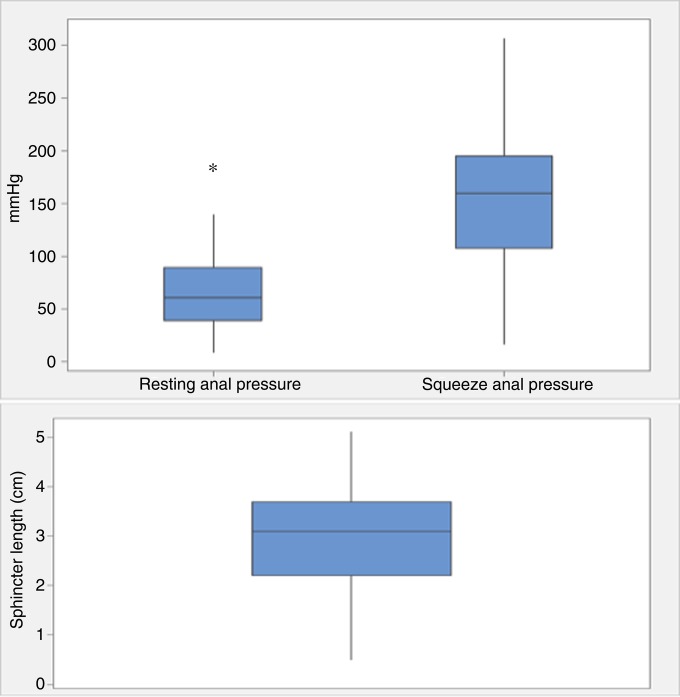
Figure 3.
Box plot graphs highlighting resting and squeeze anal sphincter pressures in mm Hg (top) and sphincter lengths in cm (bottom). The plots display the distribution of data as: minimum (bottom whisker), first quartile (lower part of box), median (line in box), third quartile (upper part of box) and maximum (top whisker).

