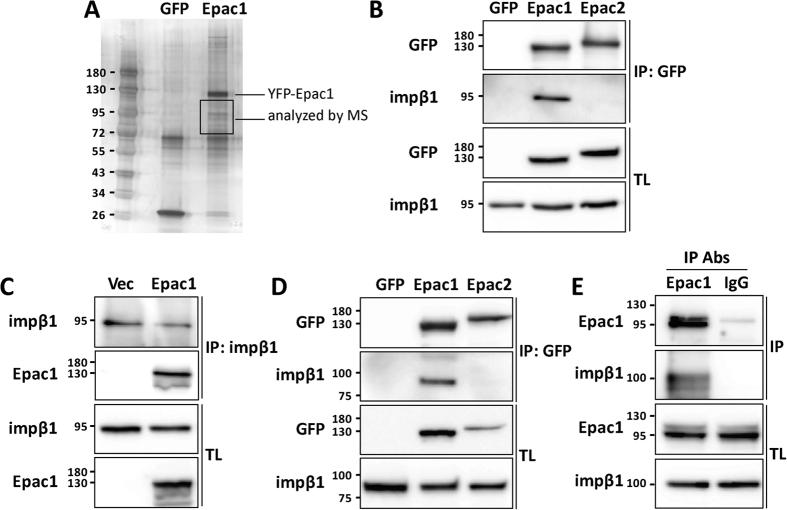
Figure 1. Identification of impβ1 as an Epac1 binding partner.
(A) Lysates from HEK293 cells overexpressing YFP-Epac1 or GFP were subjected to GFP-TRAP immunoprecipitation (IP) followed by silver staining and mass spectrometry (MS) analyses of bands between 72 and 120 kDa. Mass spectrometry results are presented in Table 1. (B) GFP-TRAP precipitates from HEK293 cells expressing YFP-Epac1, YFP-Epac2, or GFP as a negative control, were analyzed by western blotting with impβ1 and GFP antibodies. Levels of impβ1, Epac1, and Epac2 in the IP and total lysate (TL) are shown in representative western blots. (C) Impβ1 was immunoprecipitated from cells expressing HA-Epac1 or control vector using impβ1 antibody coupled to protein G-sepharose. Samples were analyzed by western blotting with impβ1 and Epac1 antibodies. Representative western blots are shown. (D) Similar to (B), GFP-TRAP precipitates from N2A cells expressing YFP-Epac1, YFP-Epac2, or GFP as a negative control, were analyzed by western blotting. (E) Endogenous Epac1 was immunoprecipitated from EA.hy926 cells using Epac1 antibody (A-5) coupled to protein A-sepharose. Proteins were visualized by western blotting using Epac1 and impβ1 antibodies.

