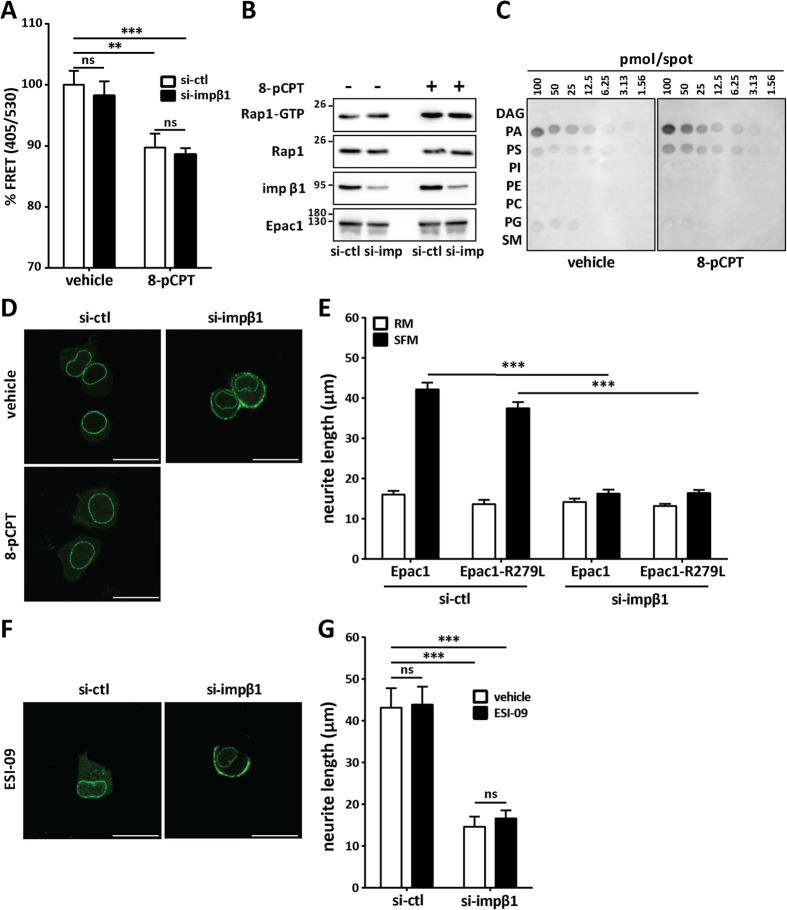
Figure 5. Knockdown of impβ1 promotes membrane accumulation of Epac1 and inhibition of neurite outgrowth independently of cAMP binding.
(A) N2A cells overexpressing the Epac1 FRET reporter were treated with si-ctl or si-impβ1 and analyzed by flow cytometry following treatment with either vehicle or 30 μM 8-pCPT-AM for 15 min. Bar graph shows the percentage of the FRET ratio (405/530) in YFP-positive cells, in si-ctl (open bars) as compared to si-impβ1 (solid bars) samples. (B) N2A cells overexpressing YFP-Epac1 were treated with si-ctl or si-impβ1, followed by treatment with vehicle or 0.1 μM 8-pCPT-AM for 15 min. Rap1-GTP was pulled down with Ral GDS-Rap binding domain beads followed by western blotting to detect Rap1-GTP and total Rap1, impβ1, and Epac1. (C) Binding of purified Epac1 to membrane lipid strips in the absence or presence of 50 μM 8-pCPT for 15 min. (D) Representative images of N2A cells overexpressing YFP-Epac1-R279L mutant (deficient in binding cAMP) and treated with si-ctl or si-impβ1 were analyzed by live cell imaging. Representative images show that YFP-Epac1-R279L localizes to the PM when impβ1 is knocked down. Lower left image confirms that Epac1-R279L does not respond to stimulation with 8-pCPT-AM. (E) N2A cells overexpressing either YFP-Epac1-R279L mutant or YFP-Epac1 and treated with si-ctl or si-impβ1, were grown in SFM (solid bars) or RM (open bars). Neurite length was analyzed as described in the legend to Fig. 3. (F) The Epac inhibitor ESI-09 does not prevent the effect of impβ1 depletion on PM accumulation of Epac1. N2A cells overexpressing YFP-Epac1 were treated with si-ctl or si-impβ1 and 5 μM ESI-09. Representative images showing that YFP-Epac1 also localizes to the PM in the presence of ESI-09 when impβ1 is knocked down. (G) N2A cells overexpressing YFP-Epac1 treated with si-ctl or si-impβ1, were grown in SFM supplemented with vehicle (open bars) or 5 μM ESI-09 (solid bars) for 24 hrs. Data in all panels were analyzed by Two-Way ANOVA; ns: not significant, ***P < 0.001, and **P < 0.01. Scale bar in all images corresponds to 25 μm.

