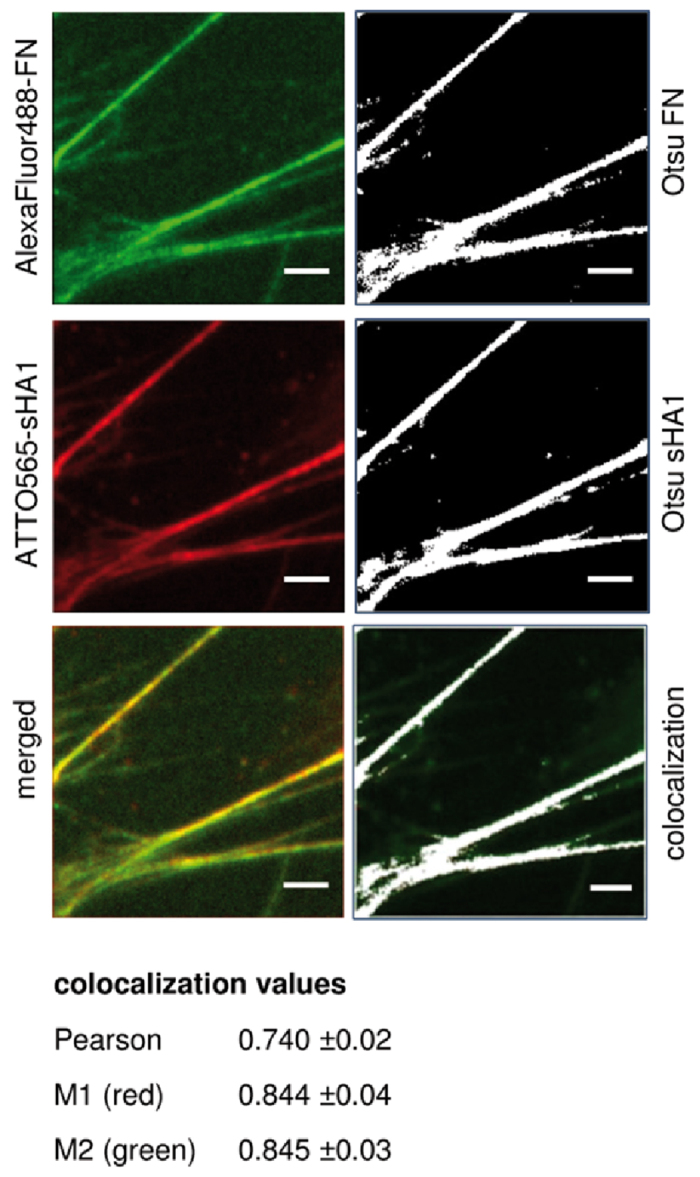
Figure 3. Colocalization analysis of FN and sHA1.

hBMSC were cultured on TCPS. From 24 h after seeding, hBMSC were treated with 5 μg AlexaFluor488-FN/mL (green fluorescence), 45 μg plasma-FN/mL and 200 μg ATTO565-sHA1/mL (red fluorescence) simultaneously. After further 48 h cells were fixed, stained with DAPI and embedded in Mowiol 4-88 as described before. Yellow fluorescence indicated overlaid structures of AlexaFluor488-FN and ATTO565-sHA1 (left panel). To identify and quantify colocalization, threshold was set using Otsu’s method and images were visualized in false colors (right panel; signal in white, background in black) and subjected to JACoP Plugin in Fiji Software. Colocalized structures are colored in white (right panel). Scale bar 5 μm. The data of colocalization analysis of 15 randomly chosen images (values as mean ± SEM (standard error of the mean)) are summarized underneath.
