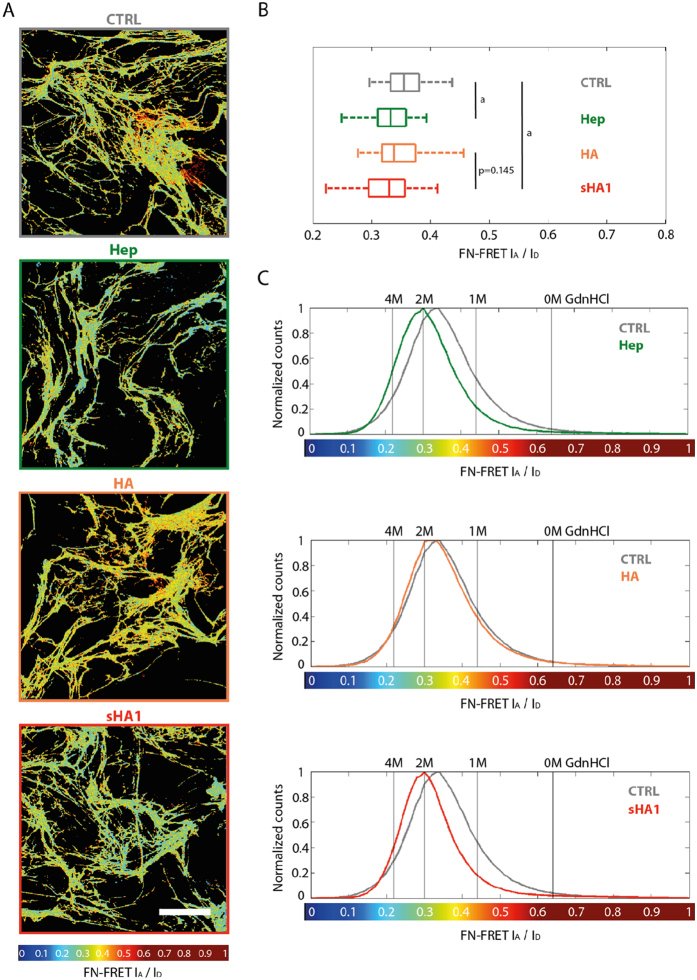
Figure 4. Impact of GAG derivatives on FN conformation.
hBMSC were cultured on TCPS and incubated with 45 μg plasma-FN/mL and 5 μg FN-DA/mL from 2 h after seeding. After 24 h, the cells were treated with Hep, HA or sHA1 (200 μg/mL each). Untreated cells served as control (CTRL). After 48 h of GAG incubation, samples were fixed with 4% (w/v) paraformaldehyde in PBS for 10 min and embedded in Mowiol 4-88. For FRET analysis FN donor and acceptor channels were visualized (A). The FRET color scheme represents the relative conformational changes on FN fibrils within a color range of red (compact) to blue (highly stretched). Scale bar 50 μm. Box and whiskers plot of mean FRET ratios calculated from four donors each in duplicate is given in (B). Statistical significances between CTRL and Hep respectively CTRL and sHA1 are indicated with a (p < 0.05). Representative histograms of FRET ratios obtained from 10 randomly chosen images after treatment with Hep (green line), HA (orange line) and sHA1 (red line) in comparison to untreated control (gray line) are shown in (C) (n = 1). The vertical lines represent FRET ratios of FN-DA in solution which was denatured in 1, 2 or 4 M GdnHCl, respectively.

