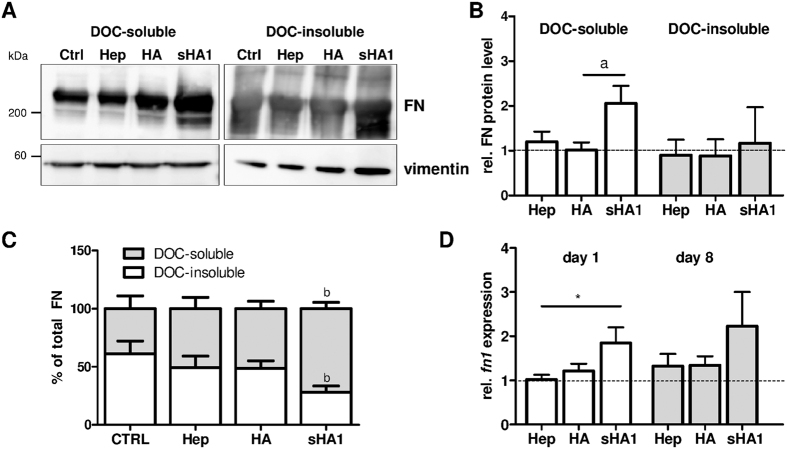
Figure 5. Influence of sHA1 on FN protein content and fn1 gene expression.
hBMSC were cultured on TCPS and treated permanently from day 1 until day 8 with 200 μg Hep/mL, 200 μg HA/mL or 200 μg sHA1/mL. Untreated cells served as control (CTRL). At day 8, cells were lysed in DOC-buffer. The DOC-insoluble proteins were subsequently solubilized in SDS buffer. Both fractions were subjected to a 4–15% (v/v) SDS PAGE gradient gel and analyzed by Western blotting for FN protein content (main bands at ~220 kDa) using vimentin (bands at ~55 kDa) as internal control. FN and vimentin were detected using monoclonal mouse anti-human IgGs/HRP-conjugated anti-mouse IgG on the same blot and subsequent chemiluminescence detection. Image in (A) presents two representative cropped Western blots of DOC-soluble and DOC-insoluble fractions from the same experiment processed in parallel (full length blots in supplementary Figure S3). Main bands from FN at ~220 kDa were identified from smeary bands from DOC-insoluble fraction. The diagram in (B) shows the densiometric quantification of Western blot signals of both fractions using ImageQuant software. Values of densiometric evaluation of FN were related to values of vimentin and then normalized to untreated control (CTRL, indicated with dotted line). Values are shown as mean ± SEM and significant differences between sHA1 and HA are indicated with a (p < 0.05). n = 4. The calculation of percentage of total FN in DOC-insoluble and DOC-soluble fractions is given in (C). Values are shown as mean ± SEM and significant differences between sHA1 and CTRL are indicated with b (p < 0.01), n = 4. At day 1 and 8 cells were lysed for RNA preparation and analyzed after reverse transcription for expression of fn1 by real time PCR (D). Comparative quantification was normalized to rps26. Values were normalized to CTRL for each time point (indicated with dotted line) and are shown as mean ± SEM. Significant differences between Hep and sHA1 at day 8 are indicated with a (p < 0.05). n = 3.

