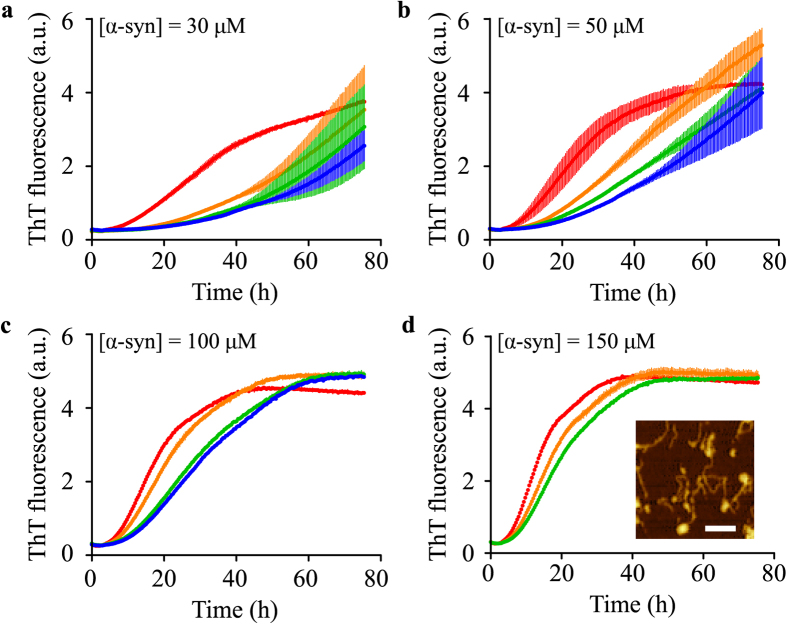
Figure 3. β-synuclein inhibition of α-synuclein lipid-induced aggregation.
Change in ThT fluorescence when 30 (a), 50 (b), 100 (c) and 150 (d) μM α-synuclein was incubated under quiescent conditions in the presence of 350 μM DMPS and in the absence (red) and presence of increasing β-synuclein concentrations (50 (orange), 100 (green) and 150 (blue) μM). The solution conditions were 20 mM phosphate buffer, pH 6.5 and 30 °C. The thickness of the various lines indicates the standard deviation in triplicate measurements. At longer timescales (see Supplementary Fig. 1) ThT fluorescence reaches the same plateau values. ((d), inset) AFM image of fibrils formed in the presence of 150 μM β-synuclein (20 μM α-synuclein, 350 μM DMPS vesicles, pH 6.5, 30 °C) diluted to 1 μM α-synuclein (kinetic data shown in Supplementary Fig. 1). The scale bar is 200 nm.

