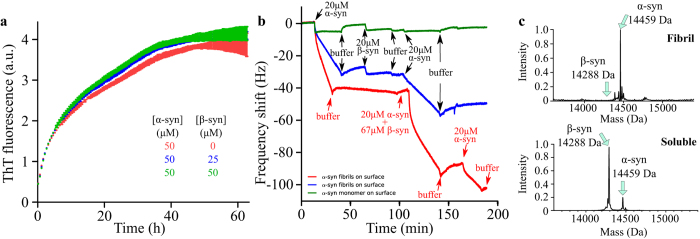
Figure 5. α-Synuclein fibril elongation in the presence of β-synuclein at pH 6.5, 30 °C.
(a) Change in the ThT fluorescence signal when solutions of 50 μM monomeric α-synuclein were incubated in the presence of 1 μM α-synuclein pre-formed seed fibrils in the absence (red) or the presence of 25 μM (blue) or 50 μM (green) monomeric β-synuclein. (b) QCM measurements at pH 6.5. α-synuclein monomers (green) or fibrils (red, blue) were covalently attached to the surface of the QCM sensors. Each trace corresponds to the change in frequency of the corresponding QCM sensor upon incubation with either buffer, α-synuclein monomers, β-synuclein monomers or a mixture of α-synuclein and β-synuclein monomers, as indicated in the figure. The red and blue traces show changes in frequencies of QCM sensors with a slightly different surface fibril density, which is responsible for the difference in frequency response upon incubation with a given concentration of monomeric α-synuclein. (c, top) Mass spectrometric analysis of α-synuclein fibrils formed in the presence of β-synuclein. The fibrils were first formed by incubating 1 μM α-synuclein seed fibrils in the presence 100 μM monomeric α-synuclein and 100 μM monomeric β-synuclein (kinetic data shown in Supplementary Fig. 4c) and then solubilised after incubation in DMSO prior to mass spectrometric analyses. The data show only one peak, at 14,458.98 ± 0.58 Da, corresponding to the molecular weight of α-synuclein, indicating no detectable incorporation of β-synuclein within α-synuclein fibrils. (c, bottom) Mass spectrometric analysis of soluble β-synuclein (100 μM) and α-synuclein (100 μM) indicating that both proteins can be ionised under the conditions used.

