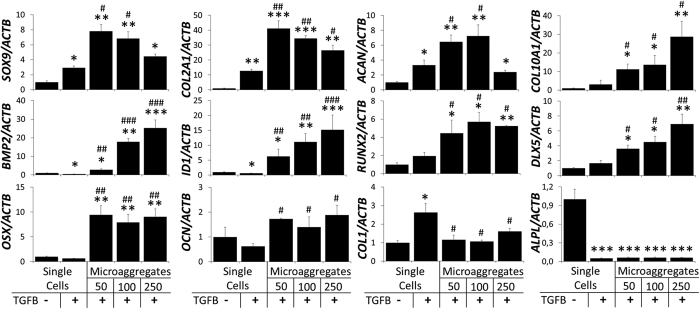
Figure 4. Microaggregation induces a chondrogenic gene expression fingerprint.
hPDCs were cultured as single cells or microaggregates in the presence or absence of 10 ng/ml of TGFB for a period of seven days and analyzed on gene expression using RT-qPCR. *P < 0.05; **P < 0.01; ***P < 0.001 as compared to single hPDCs without TGFB. #P < 0.05; ##P < 0.01; ###P < 0.001 as compared to single hPDCs with TGFB.

