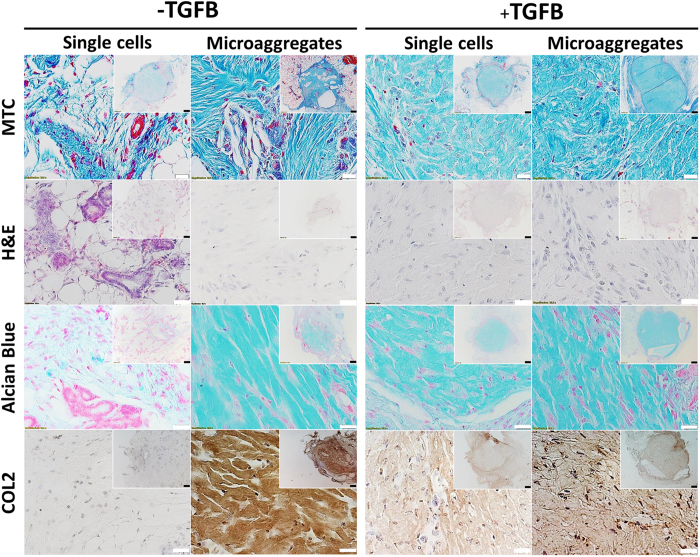
Figure 7. Cartilage formation in implants containing either single or microaggregated hPDCs three weeks post implantation.
After six days of in vitro culture, hPDCs were laden in 5 mg/ml collagen hydrogels, subcutaneously implanted for three weeks and analyzed histologically to visualize the implant and invading perfused blood vessels using Masson’s trichrome, cellular morphology using hematoxylin and eosin and cartilage formation using Alcian blue and COL2 (n = 6). White scale bars equal 200 μm. Black scale bars equal 1 mm.

