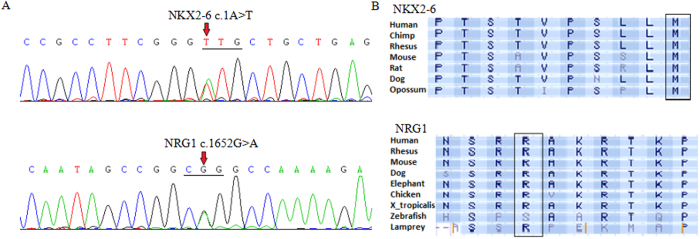
Figure 3. Sequence analysis of NKX2-6 and NRG1.
(A) Gene sequencing peak map showing the NKX2-6 and NRG1 mutations, the arrow indicates the altered heterozygous nucleotides of c.1A > T in NKX2-6 and c.1652G > A in NRG1. (B) Alignment of multiple NKX2-6 and NRG1 amino acid sequences among species. The NKX2-6 and NRG1 amino acid residues affected by these mutations are evolutionarily conserved across various species.

