
Figure 2. SDS-PAGE analysis and activity staining of MaAmyB.
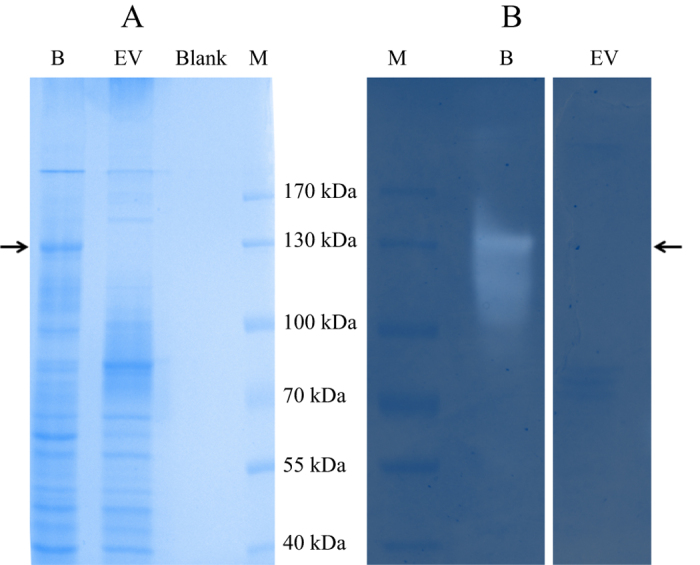
(A) Regular SDS-PAGE analysis. (B) In gel staining for starch hydrolyzing activity. Arrows indicate the position of MaAmyB. After SDS-PAGE the gels were washed with standard assay buffer, then incubated for 2 h at 37 °C in standard assay buffer containing 0.5% soluble starch and activity was visualized by staining with Lugol’s Iodine solution. The band seen in A corresponds to the main activity band in B. Both bands run at the predicted molar mass of 135 kDa for MaAmyB. The empty vector control did not show a band at 135 kDa (A) and lacked any other activity band (B). For each sample 10 μg protein was loaded. B = MaAmyB eluted from starch granules; EV = Empty vector control eluted from starch granules; Blank = Blank control eluted from starch granules; M = marker proteins.