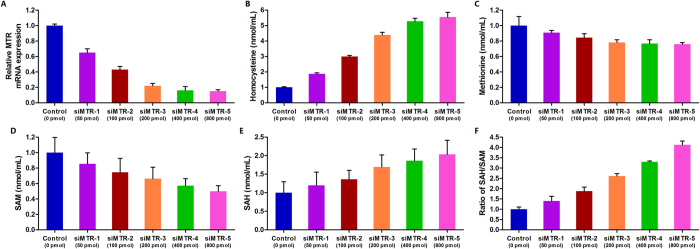
Figure 3. Down-regulation of MTR contributes to elevated cellular homocysteine and SAH levels, reduced methionine and SAM levels, and increased SAH/SAM ratio in PC3 cells.
(A) Knockdown efficiency of gradient MTR siRNA was measured using quantitative real-time polymerase chain reaction. (B) Cellular homocysteine concentration after transfection with gradient MTR siRNA. (C) Cellular methionine level after transfected with gradient MTR siRNA. (D) Cellular SAM level after transfection with gradient MTR siRNA. (E) Cellular SAH level after transfection with gradient MTR siRNA. (F) Ratio of SAH/SAM after transfection with gradient MTR siRNA. Each value represents the mean ± SD of three independent experiments, and each experiment was performed in triplicate.

