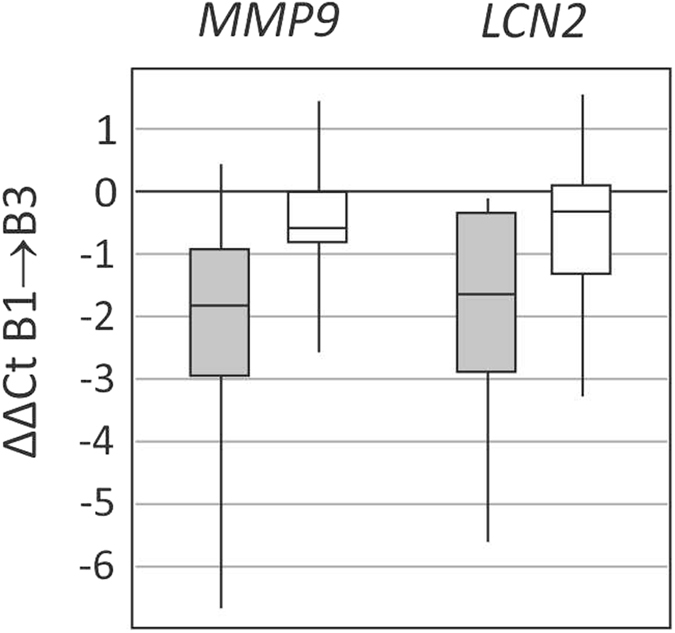
Figure 2. The change in MMP9 and LCN2 gene expression levels over ischemia time in matched pairs of the kidneys from the same donor as observed in IBT (grey box) vs ST group (white box).

Data presented as median (horizontal line), interquartile range (box), and values range (vertical line).
