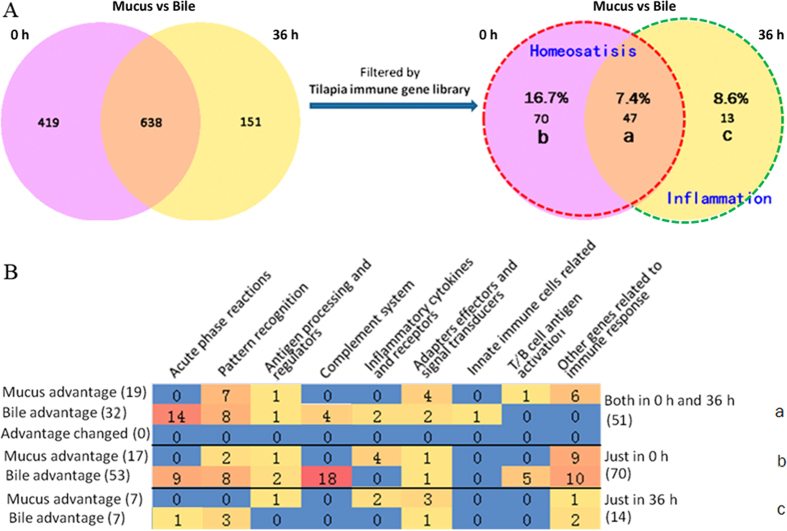
Figure 5. Venn-regional analysis of intestinal mucus or bile advantage proteins.
(A) Venn analysis between data of steady (0 h) and inflammational (36 h) for both the total and immune differential proteins between intestinal mucus and bile, and the percentage of immune proteins vs total proteins was labeled in each region. The total No. of differentially expressed genes between intestinal mucus and bile was 1057 and 789 at 0 h and 36 h respectively, and after filtered by immune gene library the numbers decreased to 117 and 60. The dashed red lined regions, including region a and b, indicated data at 0 h, in another word in homeostasis status, whereas the dashed green lined region (c) specifically indicated data upon inflammation (36 h). (B) Protein No. involved in major immune processes for each region. In region a, the most enriched mucus advantage proteins were involved in “pattern recognition”, “adapters, effectors and signal transducers”, as well as “other proteins related to immune response”; meanwhile, for bile advantage ones, in “acute phase reactions”, “pattern recognition”, and “complement system”. In region b, the most enriched mucus advantage ones were involved in “other proteins related to immune response” and “inflammatory cytokines and receptors”; meanwhile, for bile advantage ones, in “complement system”, “other proteins related to immune response”, “acute phase reactions”, “pattern recognition”, and “T/B cell antigen activation”. In region c, there were much fewer immune proteins, with the most enriched mucus advantage ones in “adapters, effectors and signal transducers” as well as in “pattern recognition” for bile.

