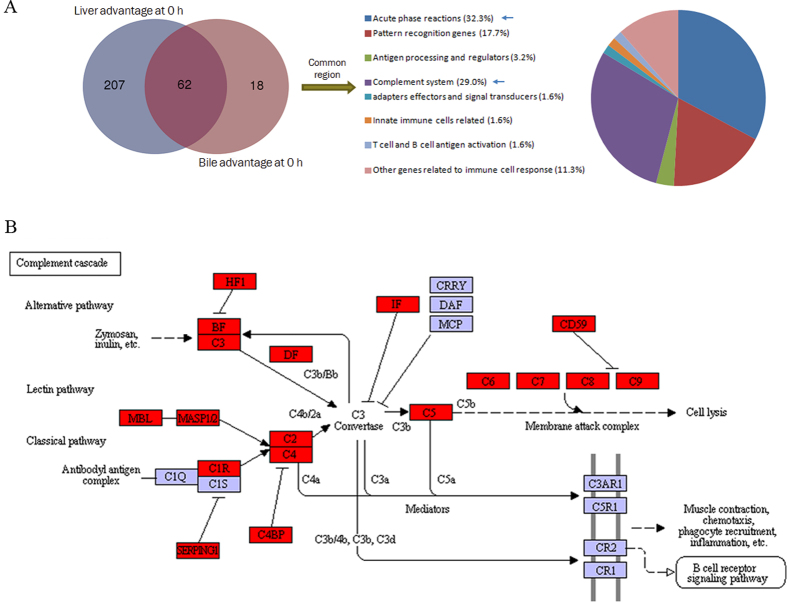
Figure 6. Analysis of common genes between liver advantage transcripts and bile advantage proteins.
(A) Venn analysis between genes of both liver advantage transcripts and bile advantage proteins, with percentages of common components. (B) The KEGG pathway graphic of complement cascades in bile advantage proteins at steady state (0 h). Three complement activating pathways as well as inhibitory factors were revealed.

