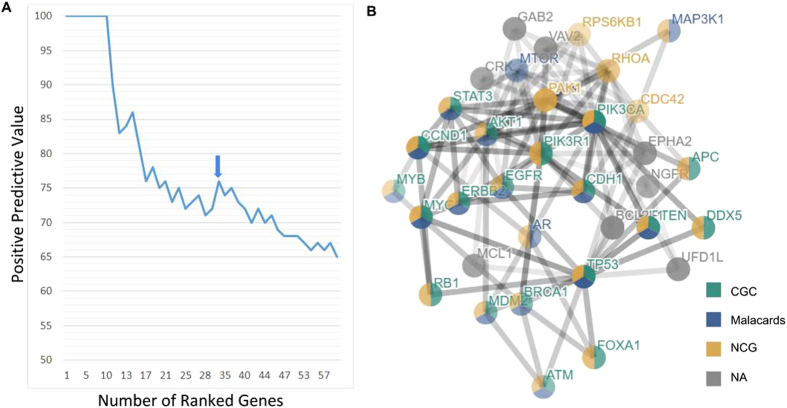
Figure 3. Application of SSA-ME on TGCA Breast Cancer dataset.
(A) Determination of the number of genes to be prioritized as cancer drivers. Genes were ranked according to their gene score obtained by SSA-ME. The X-axis represents the number of genes in the list of prioritized genes obtained by setting a cut-off on the rank. The Y-axis represents the positive predictive value (PPV) for the genes present in each list that corresponds to a given rank threshold. The PPV is defined as the number of true driver genes prioritized divided by the number of prioritized genes. Note that the true driver genes are defined as all genes present in CGC. At the chosen threshold (arrow) 34 potential cancer drivers were prioritized. (B) Subnetwork obtained after using SSA-ME on the TGCA breast cancer dataset. Genes are represented by nodes. If the gene had been associated with cancer, this is indicated by the color of the database in which the association was described. Gray genes correspond to genes not present in the Census of Cancer Genes, Malacards (breast cancer) or the Network of Cancer Genes database. The size of the node reflects the number of samples in which a gene was found mutated.

