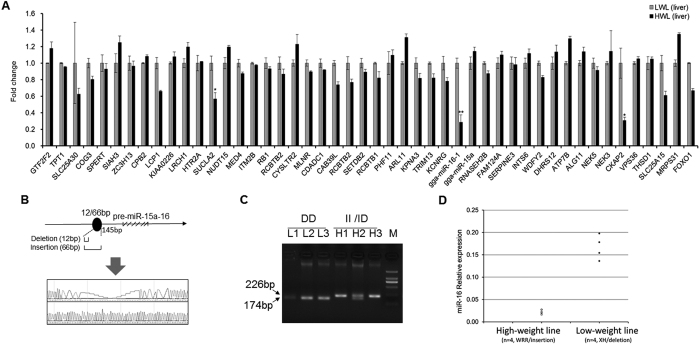
Figure 1. Identification of miR-16-1 as the major candidate gene.
(A) Gene expression profiling of all the candidate genes within the QTL region mapped by genome-wide association study (GWAS) on body weight. Microarray was performed for mRNA and miRNA expression in liver tissue from high-weight and low-weight line chickens. Differentially expressed mRNAs and miRNAs were identified by ANOVA analysis and false-positive (Fold change >1.5; p < 0.01). (B) A 54-bp insertion mutation was identified in the primary of miR-15a-16 in chickens. This mutation was located 145 bp upstream of miR-15a-16 precursor. (C) Gel electrophoresis was performed for mutation detection in the distinct chicken lines. (D) miR-16 expression in the muscle tissue of fast-growing and slow-growing female chickens (n = 4 per line). The fast-growing line is from the white recessive rock breed with insertion homozygous genotype of the miR-15a-16. The slow-growing line is the Xinghua indigenous breed with a wild deleltion homozygous genotype of miR-15a-16. Relative expression values were calculated using the 2−∆Ct method. The data are presented as the means ± SD. *p < 0.05 and **p < 0.01 were estimated by Student’s t-test.

