
Figure 4. Overexpression of NAOD or overexpression of mNAOD provides selective advantage during adaptation to NO.
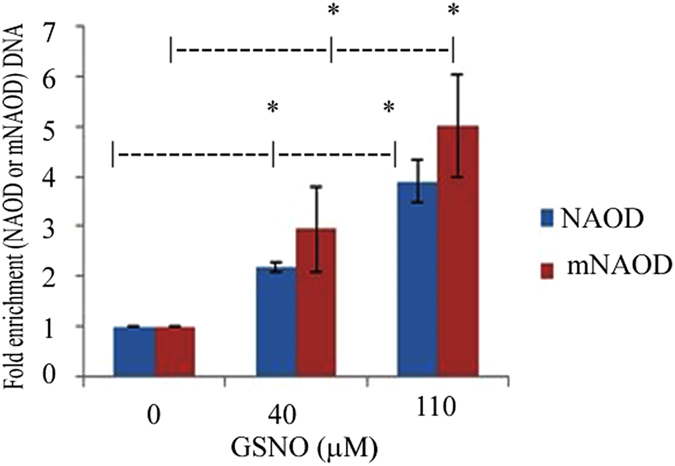
(A) Competition between pcontrol trophozoites and NAOD trophozoites or pcontrol trophozoites and mNAOD trophozoites during adaptation to NO. qPCR analysis of NAOD or mNAOD and neo was performed on extrachromosomal DNA that was prepared from mix cultures that have been adapted to 40 and 110 μM GSNO. The level of neo which is carried by pcontrol plasmid, NAOD plasmid and mNAOD plasmid was used to normalize the data. Data are expressed as the mean ± SD of three independent experiments. *p ≤ 0.05 and is the significance of the difference between the amount of NAOD DNA or mNAOD DNA in the trophozoite population cultivated in absence of GSNO or in presence of 40 or 110 μM GSNO according to the results of an unpaired Student’s t-test.