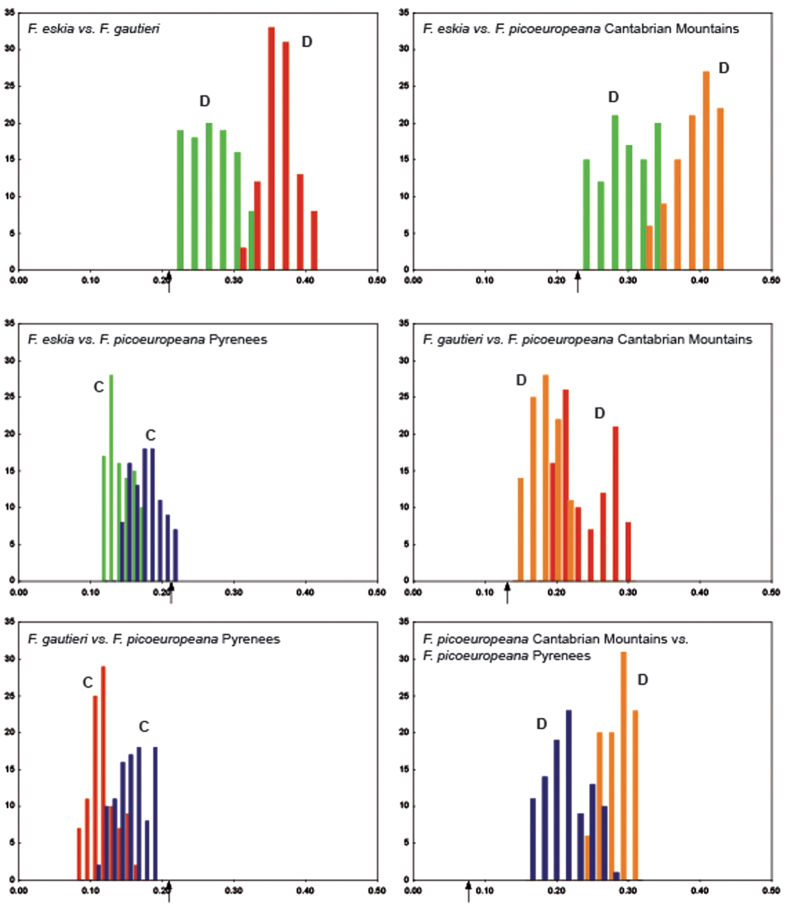
Figure 7. Pairwise comparison between the two parental species and the two populations of F. picoeuropeana to test niche divergence and conservatism under current climatic conditions.
Schoener’s D niche-overlap values (arrows) are compared to a null distribution of background divergence. Values smaller than the null distribution suggest niche divergence (D), whereas larger values indicate niche conservatism (C). Key colors: F. eskia (green); F.gautieri (red); Cantabrian F. picoeuropeana (orange); Pyrenean F. picoeuropeana (blue).

