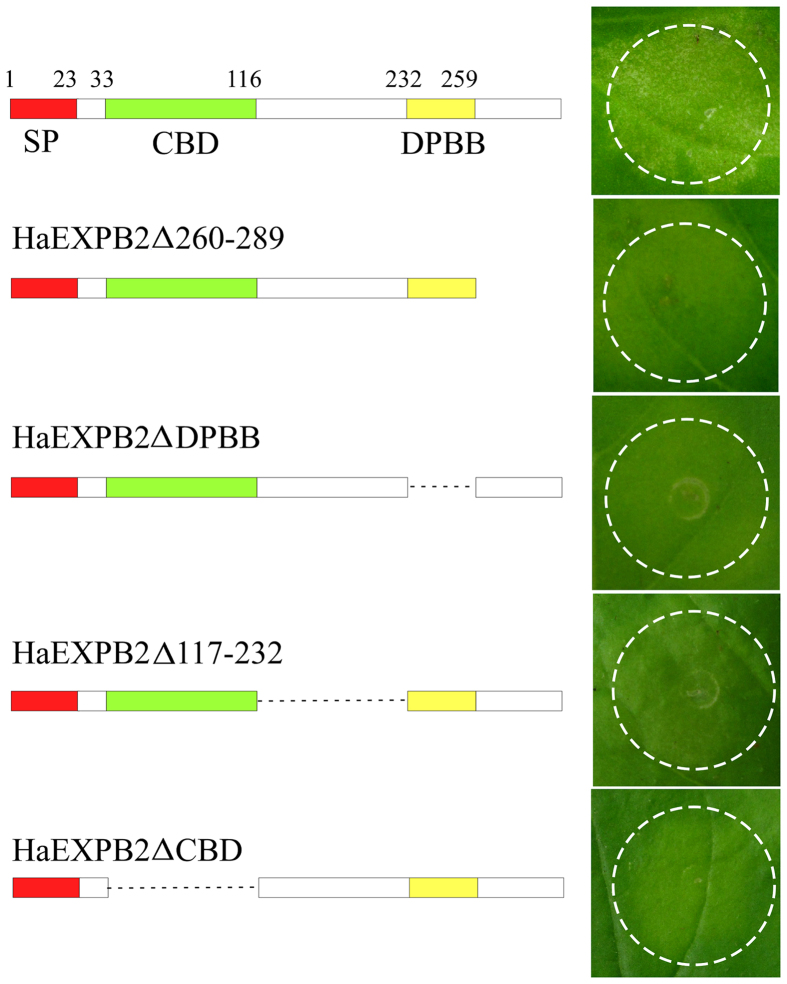
Figure 2. Structural analysis of the regions of HaEXPB2 responsible for inducing cell death.
Schematic views of HaEXPB2 and their deletion mutants are shown on the left. The predicted domains or motifs of HaEXPB2 are represented as colored rectangles. The deleted regions are represented as dotted lines. HaEXPB2 and their deletion mutants were transiently expressed in N. benthamiana leaves. Each experiment was repeated at least three times with similar results.

