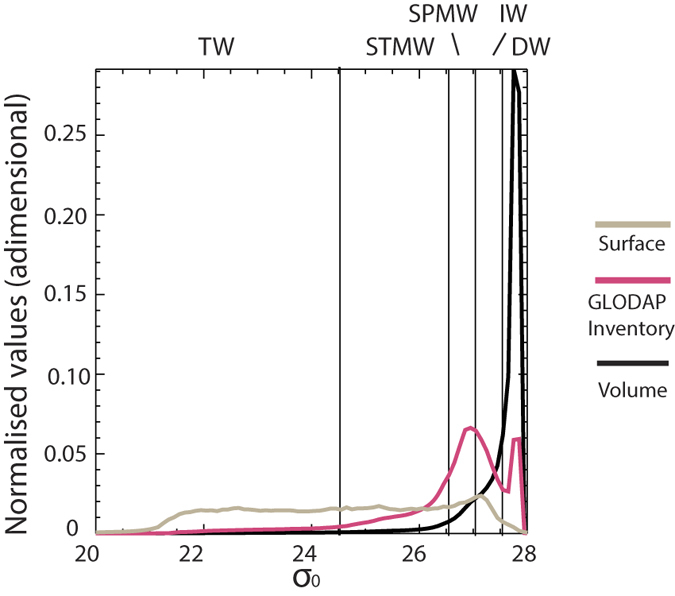
Figure 2. The global oceans density layering: outcrop areas, volumes and carbon inventories.

Global ocean outcrop surface (grey), volume (black) in density space from monthly density fields from the World Ocean Atlas 200941 and global Cant inventory in density space (magenta) from GLODAP in red (ΔC*1). Areas under the curves have been normalised to unity. Important water mass bands are demarcated, distinguishing tropical waters (TW;  ), subtropical mode waters (STMW;
  ), subpolar mode waters (SPMW;
  ), intermediate waters (IW;
  ), and deep waters (DW;
  ).
).
