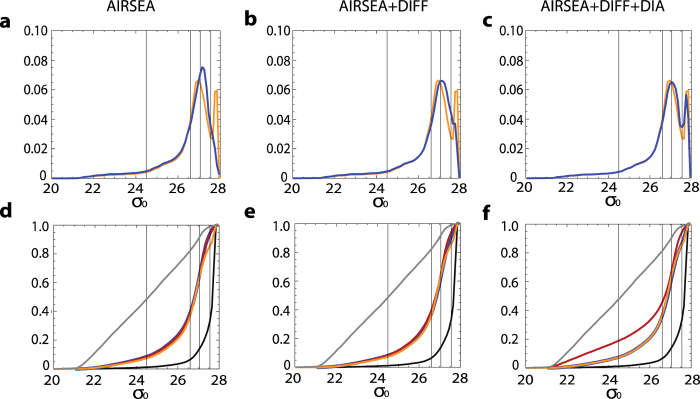
Figure 4. Results from the conceptual model. Here the inventory obtained with conceptual model are compared with GLODAP.
First we consider the AIRSEA case (a) with the GLODAP inventory in orange and in blue the inventory predicted by the numerically integrated conceptual model (Eq. 2). Both inventories integrals were normalised to 1 to ease comparison. The analytical solution presented in the text has not been superimposed since it coincides with the numerical one. (b) Same as (a) but for AIRSEA + DIFF case. (c) Same as (a) but for AIRSEA + DIFF + DIA case. The cumulated terms of the Eq. 2 are also presented, with each cumulated variable being normalised to unity. The case AIRSEA is shown in (d) with in blue the rate of change of the inventory (blue) and in red the carbon air-sea fluxes. For each density value these are thus the estimates of the corresponding rates of change occurring for the layers having lower or equal densities. The cumulated GLODAP inventory (orange), WOA outcrop areas (grey), WOA layer volumes (black) are also shown. The color scheme is the same in Fig. 5, where the equivalent GCM estimates are presented. (e) the same as (d) but for the AIRSEA+DIFF case. (f) the same as (d) but for the AIRSEA + DIFF + DIA case.

