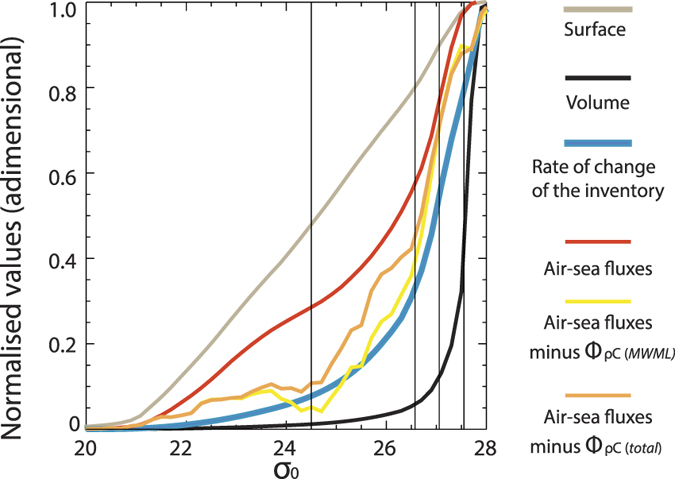
Figure 5. Global carbon budgets.

Model global estimates of the terms in Eq. 8. Integrals in Eq. 8 are performed cumulating from  . Grey: Integrated outcrop area (i.e., for each density value
  the area where
  ; Red: Integrated uptake of anthropogenic carbon by gas exchange during 1995; Blue: Integrated rate of interior accumulation during 1995 (Note: in fact, it is very similar to the integrated global model inventory of Cant); Black: Integrated volume of the ocean density layers. The difference between the red and the light-blue curve illustrates the importance of processes other than the air-sea fluxes setting the inventory. Additionally, the yellow curve represents the air-sea fluxes minus the diapycnal transports of Cant in the MWML (Fig. 6b; Eq. 8) while the orange curve represents the air-sea fluxes minus the total diapycnal transports (first and last terms in Eq. 8). The difference between the latter and the inventory is due to diffusive Cant fluxes.
