
Figure 6. Net MWML diapycnal transports.
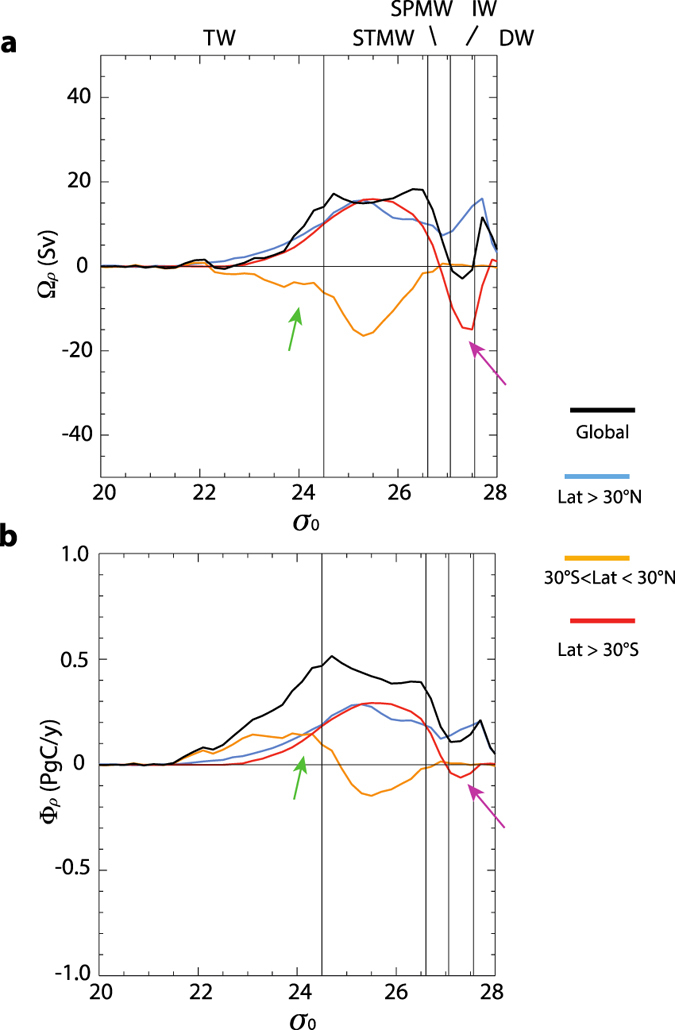
(a) Volume (Ωρ) and (b) Cant (Φρ) transformation fluxes in the MWML due to all processes over the density range  . In (a–b), oblique magenta arrows underline the large difference between volume and Cant transports associated with the upwelling of CDW. The green arrow points to the density range showing the greatest difference between heat and Cant transformation fluxes, the latter having a much smaller (but not negligible) re-emergence at the Equator. Line colors show global (black) and latitude-separated results: North of 30°N (blue), between 30°N and 30°S (orange), south of 30°S (red). In all panels, positive (negative) transformation values represent diapycnal transports towards denser (lighter) densities. The slope of the lines represents the formation: convergence (negative slope) and divergence (positive slope). Values for σ0 < 26.4 were smoothed with a 3-points running mean filter.