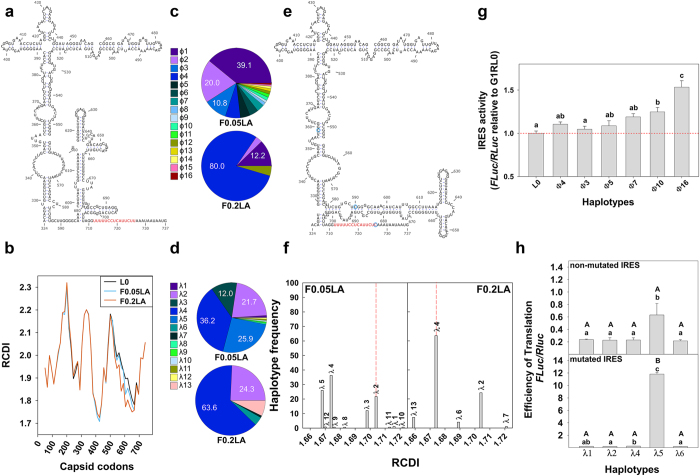
Figure 1. Genomic selection based on fragments belonging to IRES and VP1 regions.
(a) Predicted secondary structure of the HAV IRES. In red the second polypyrimidine tract (pY2). (b) RCDI of the capsid-coding region. (c) Percent of haplotypes detected in the IRES fragment of populations F0.05LA and F0.2LA. (d) Percent of haplotypes detected in the VP1 fragment of populations F0.05LA and F0.2LA. (e) Alternative secondary structure predicted in several IRES haplotypes. In red pY2. Blue circles indicate the replacements found in ɸ16 haplotype. (f) RCDI values of the VP1 haplotypes. Red line corresponds to the haplotype whose sequence coincides with the consensus. (g) IRES activity figured as the mean and standard error of the FLuc/RLuc ratio of different haplotype-derived vectors compared to the ancestor L0 type. Three different experiments, including two replicas each, for each haplotype were performed. Statistically significant differences (P < 0.05; Student’s t-test) between haplotypes are indicated by different letters: a ≠ b, a ≠ c, b ≠ c, ab = a, ab = b, ab ≠ c. (h) Translation efficiency of different VP1 haplotype-derived vectors under the control of the wild type IRES without or with mutations U359C, U590C and U726C. Values represent the mean and standard error of three different experiments, including two replicas each, for each haplotype. Statistically significant differences (P < 0.05; Student’s t-test) between haplotypes are indicated by different letters: a ≠ b, a ≠ c, b ≠ c, ab = a, ab = b, ab ≠ c. Statistically significant differences (P < 0.05; Student’s t-test) between the non-mutated and mutated IRES, for each haplotype, are indicated by different letters: A ≠ B.

