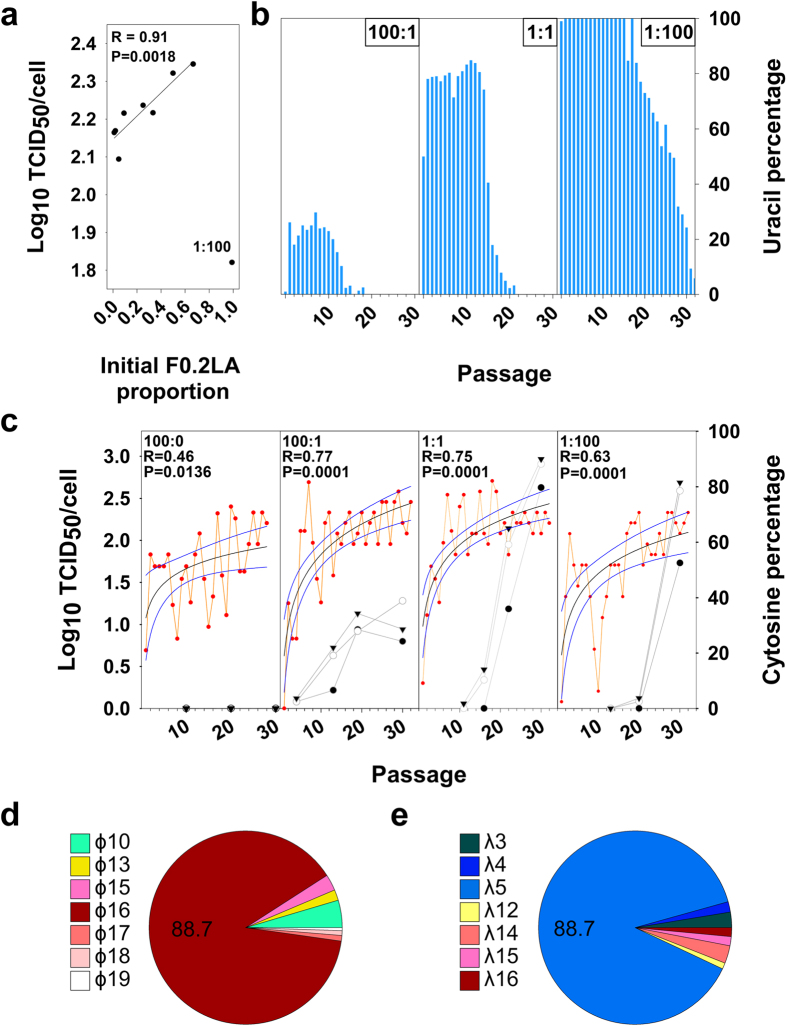
Figure 3. Selection of ɸ16-λ5 haplotype through molecular breeding between F0.05LA and F0.2LA populations.
(a) Correlation between the initial proportion of F0.2LA population and the virus titers produced. R is the correlation coefficient and P the level of significance. (b) Evolution of a genetic marker of F0.2LA population (1298U in VP0 gene) over passages in the molecular breeding experiments 100:1, 1:1 and 1:100. (c) Evolution of virus production and emergence of U359C (●), U590C (○) and U726C (▼) IRES replacements over passages in the molecular breeding experiments 100:1, 1:1 and 1:100. A non-linear logarithmic regression between virus production per cell and passages is shown; the black line represents the regression line and the blue lines represent the 95% confidence levels. R is the correlation coefficient and P the level of significance. (d) Proportion of haplotypes detected in the IRES fragment of the p30 of the 1:1 (F0.05LA:F0.2LA) breed. (e) Proportion of haplotypes detected in the VP1 fragment of the p30 of the 1:1 (F0.05LA:F0.2LA) breed.

