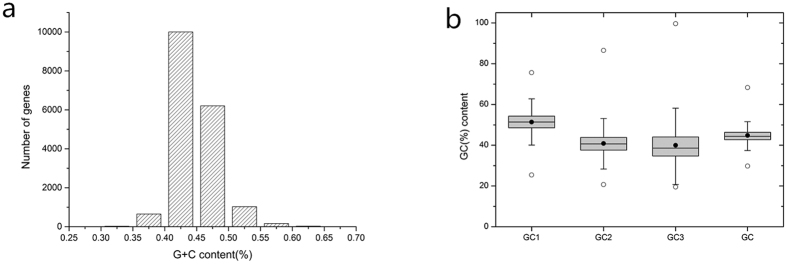
Figure 1.
(a) Distribution of G + C contents in G. biloba unigenes. (b)Box plot of G. biloba GC content variation in different coding positions. The dark dots represent the mean, the bottom and top of the box were the lower and upper quartiles, respectively, and the ends of the whiskers were the lowest and highest data still within 1.5 times the interquartile range of the lower and higher quartiles, respectively.

