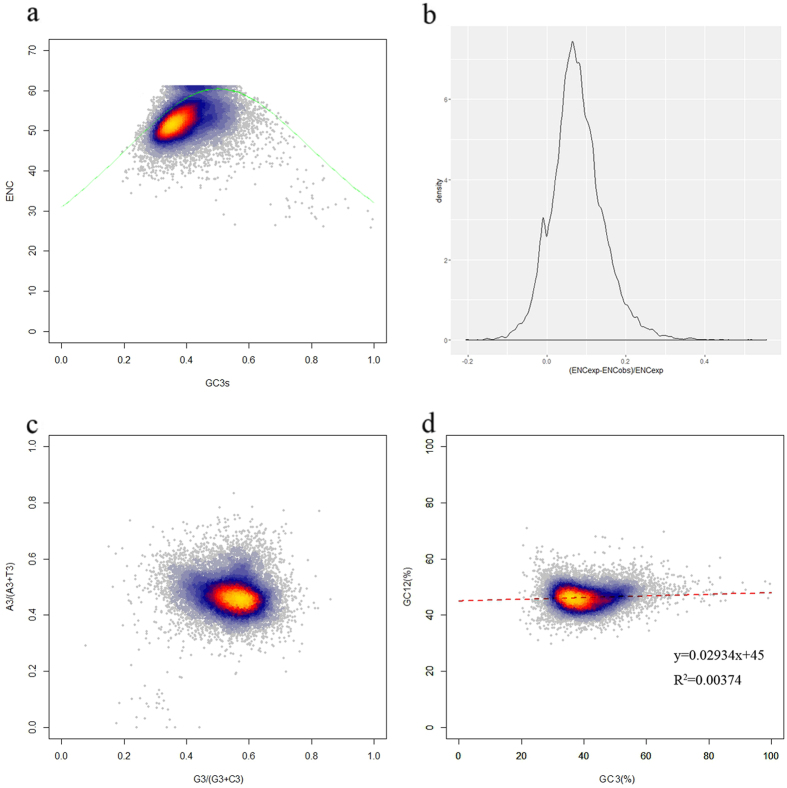
Figure 2.
(a) ENC–GC3 plot. ENC represents the effective number of codons, and GC3 is the GC content of synonymous codons at the third position. The solid line represents the expected curve when codon usage bias is only affected by mutation pressure. (b) Frequency distribution of effective number of codons (ENC). (c) PR2-bias plot [A3/(A3 + U3) against G3/(G3 + C3)] of G. biloba four-fold degenerate codons. (d) Neutrality plot analysis of GC12 and GC3 contents. GC12 in this regression plot represents the average value of GC contents at the first and second positions in each codon, and GC3 is the GC content at the third position (r = 0.061, p < 0.01).

