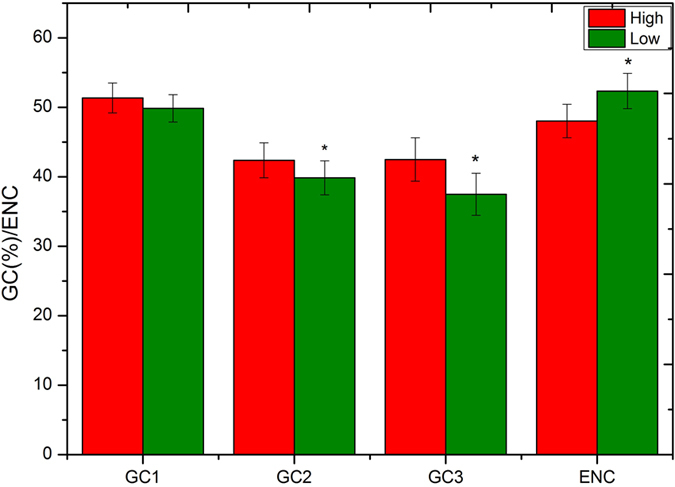
Figure 3. GC content and codon usage bias variation among high and low-expression unigenes.

Each 1,500 unigenes with highest and lowest FPKM values were regarded as high/low datasets respectively. Asterisk represents p < 0.05 by t-test.

Each 1,500 unigenes with highest and lowest FPKM values were regarded as high/low datasets respectively. Asterisk represents p < 0.05 by t-test.