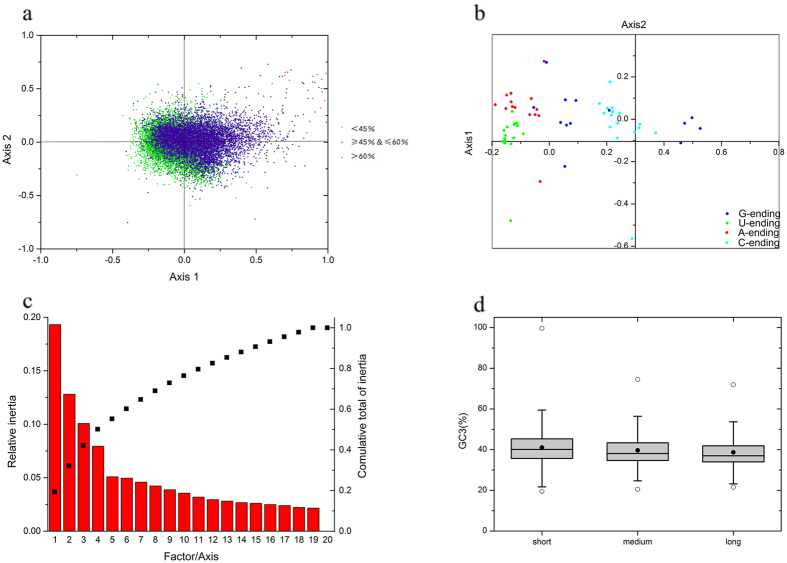
Figure 4.
(a) Correspondence analysis of various GC content unigenes based on RSCU values. (b) Correspondence analysis of codons ending with different codons based on RSCU values. (c) The relative and cumulative inertia of the first 20 factors from correspondence analysis based on the amino acid usage frequencies. (d) Box plot of GC content variation with different protein length. The dark dots represents the mean, the bottom and top of the box were the lower and upper quartiles, respectively, and the ends of the whiskers were the lowest and highest data still within 1.5 times the interquartile range of the lower and higher quartiles, respectively.

