
Fig. 4.
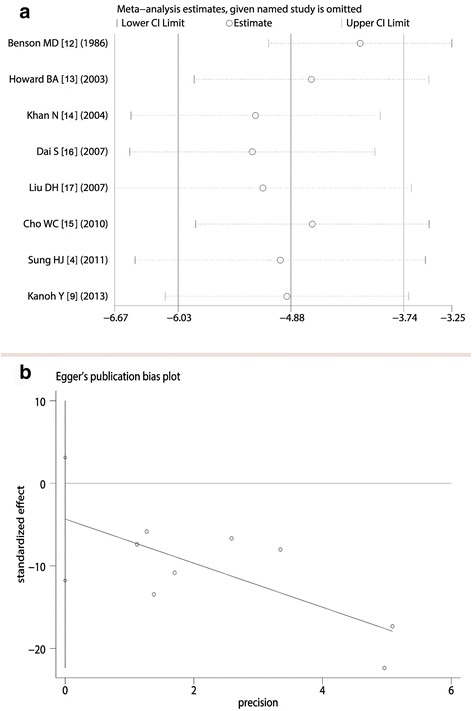
Analysis of sensitivity and publication bias. a For comparison of SAA level between lung cancer and healthy individuals, exclusion of studies on an individual basis did not substantially modify the estimators; b Z value of the Egger test was −1.42 (Pr > |z| = 0.25), implied that there was no publication bias for these studies