
Fig. 3.
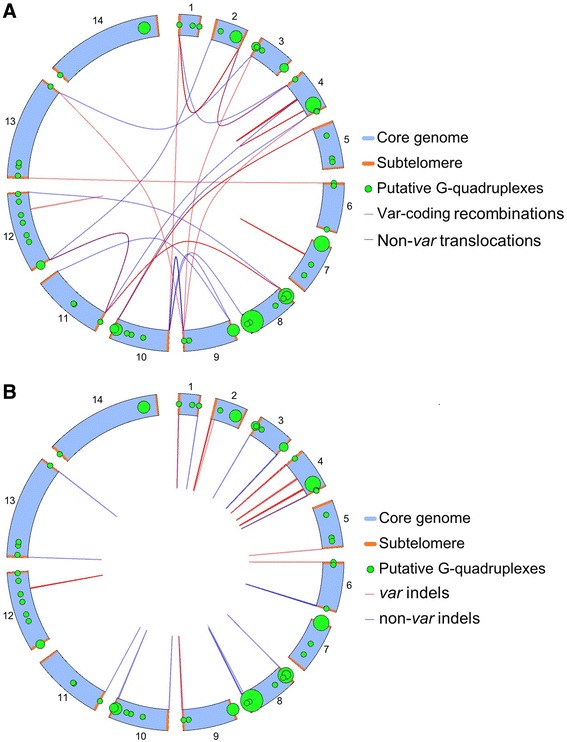
Schematics of PQSs and mitotic recombination events in the P. falciparum 3D7 genome. Schematics show the distribution of PQSs (green circles) across the 14 chromosomes, together with all recombination events recorded in the 3D7 genome (lines). a All var recombination events (red) and other non-var translocations (blue). b All indels, involving only a single chromosome: var (red) and non-var (blue). Circles representing PQSs are scaled in diameter according to the number found within each ~64 kb of the genome, represented by 1° of the 360° in this circular schematic. Overlapping circles occur in places where many PQSs lie within a single segment, making the circle large enough to overlap with adjacent segments