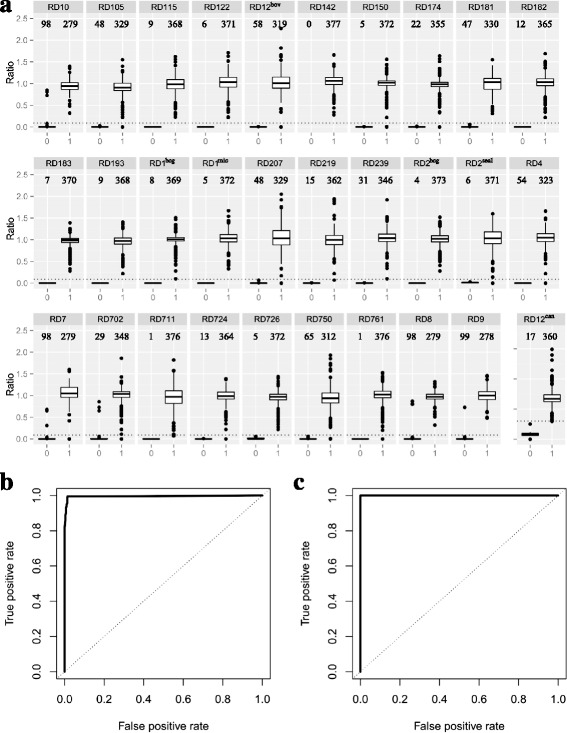
Fig. 2.

Threshold selection in RD-Analyzer. a Different ratios of read depths between present and absent RDs. The ratio refers to the ratio between the median read depth along the RD sequence and estimated genome read depths. The dotted lines indicate the optimal threshold of the read depth (0.09 for all RDs, except 2.97 for RD12can). The numbers above the boxes indicate the number of instances included in the box. b ROC curve for threshold selection for RDs except RD12can. The ROC curve shows very high TPR and very low FPR at nearly all thresholds with the area under the curve being 0.9907. The dotted diagonal line is the line of no discrimination. The default threshold was selected to be 0.09, which produced a TPR of 0.9949 and an FPR of 0.9856. c ROC curve for threshold selection for RD12can. The ROC curve has an AUC of 1. The default threshold was selected to be 2.97, producing a TPR of 1.0000 and an FPR of 1.0000
