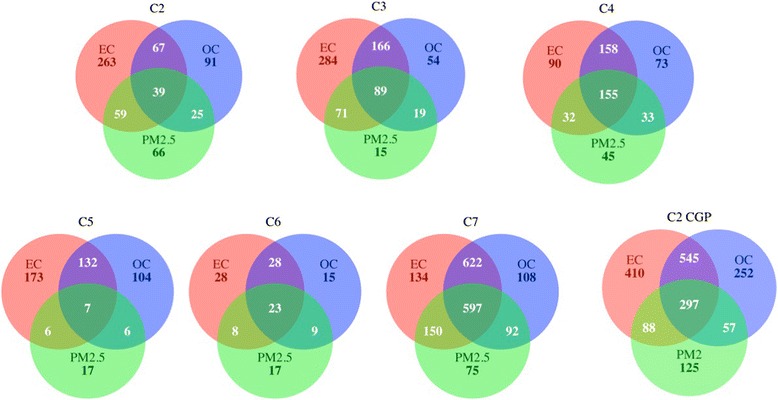
Fig. 2.

Venn Diagrams for gene sets. The numbers of the gene sets that were significantly enriched with FDR < 0.25 and nominal p-values < 0.05. Note: C2 = curated gene sets (excluding CGP gene sets, see below), C3 = motif gene sets, C4 = computational gene sets, C5 = GO gene sets, C6 = oncogenic signatures, C7 = immunologic signatures, CGP = Chemical and genetic perturbations
