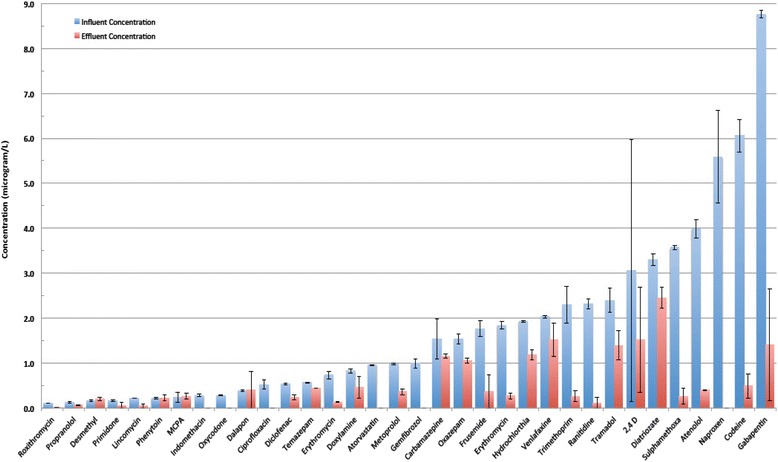
Fig. 2.

Removal of micropollutants with low to medium levels of pollutant in the influent (Mean with error bars depicting minimum and maximum observed values)

Removal of micropollutants with low to medium levels of pollutant in the influent (Mean with error bars depicting minimum and maximum observed values)