
Fig. 4.
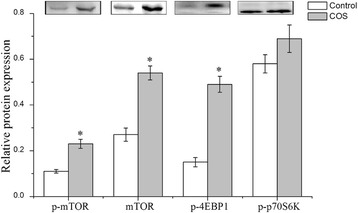
Relative protein expression of mTOR pathway in the placenta of sows consuming control, COS diets during late gestation and lactation. Values are means (n = 4) with their standard errors represented by vertical bars
Official websites use .gov
A
.gov website belongs to an official
government organization in the United States.
Secure .gov websites use HTTPS
A lock (
) or https:// means you've safely
connected to the .gov website. Share sensitive
information only on official, secure websites.
Relative protein expression of mTOR pathway in the placenta of sows consuming control, COS diets during late gestation and lactation. Values are means (n = 4) with their standard errors represented by vertical bars