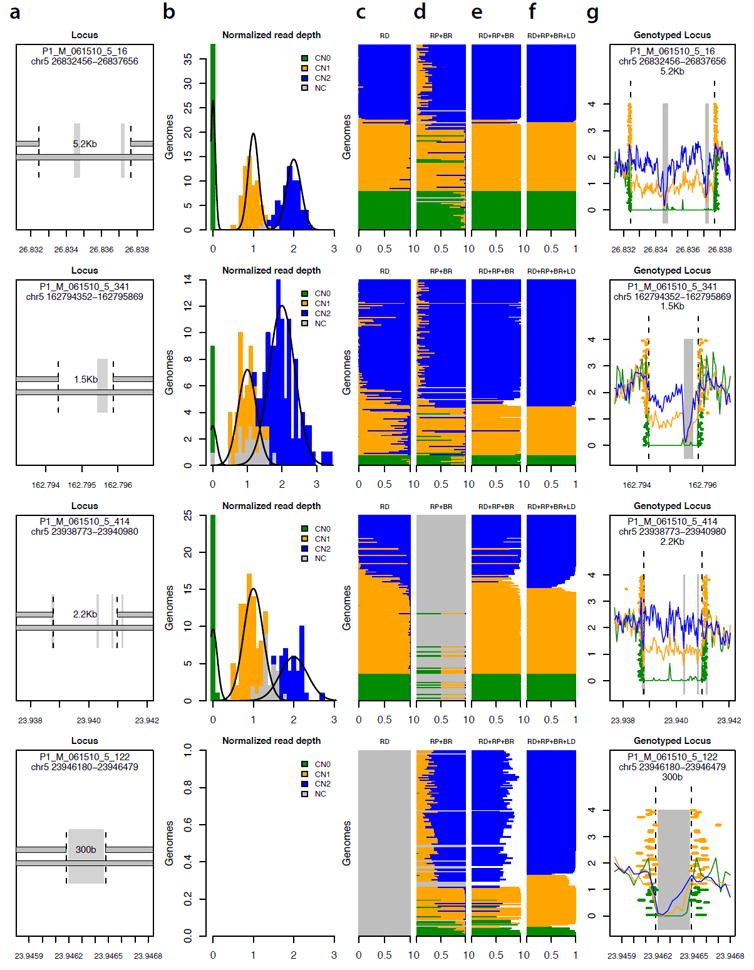
Figure 5.

Determining the allelic state (genotype) of 13,826 deletions in 156 genomes.
(a) Four of the 13,826 deletion polymorphisms analyzed, representing diverse properties in terms of size and alignability of the affected sequence. Grey vertical rectangles indicate sequence that is repeat-masked or otherwise non-alignable. The locus in the bottom row is an ALU insertion polymorphism.
(b) Population-scale distribution of read depth across genomes, at each of the deletion loci in (a). For each locus, normalized measurements of read depth (across the deleted segment) from 156 genomes are fitted to a Gaussian mixture model. Colored squares represent genomes for which genotype could be called at 95% confidence based on read depth.
(c) Genotype likelihood from read depth. Each horizontal stripe (corresponding to one of the 156 genomes) is divided into three sections with length proportional to the estimated relative likelihood of the sequence data given each genotype model (blue: copy-number 2; green: copy-number 1; orange: copy-number 0).
(d) Genotype likelihood based on evidence from read pairs (RP) and breakpoint-spanning reads (BR). At the third locus from top, the absence of an established breakpoint sequence limits inference to read pairs.
(e) Genotype likelihood based on integrating evidence from read depth (RD), read pairs (RP) and breakpoint-spanning reads (BR).
(f) Genotype likelihood based on integrating evidence from (c-e) with flanking SNP data in a population haplotype model.
(g) Population-scale sequence data at each locus, as resolved into genotype classes. Traces indicate average read depth for genomes of each inferred genotype. Orange and green rectangles indicate evidentiary read pairs and breakpoint-spanning reads, colored by the genotype determination for the genome from which they arise.
