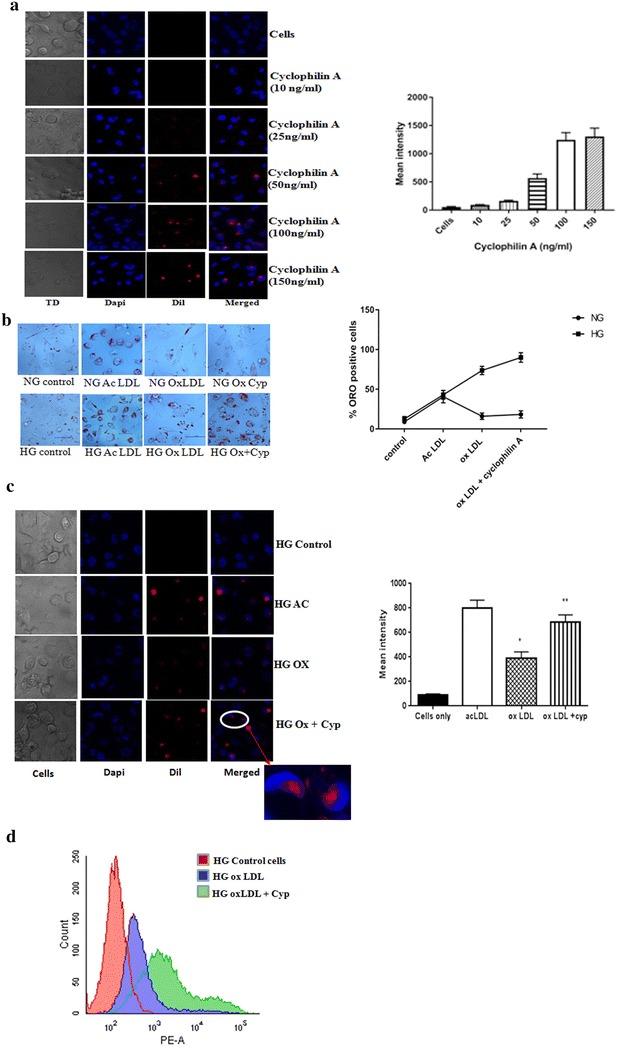
Fig. 3.

a THP cells were treated with cyclophilin A at doses of 10, 25, 50, 100 and 150 ng/mL in the presence of high glucose (HG). HG indicates RPMI culture media primed with glucose (20 mM/L). Lipid uptake was measured using confocal microscopy after treatment with oxidized LDL for 4 h. Maximal effect was observed at a dosage of 100 ng/mL of cyclophilin A. b Photomicrographs of lipid laden macrophages stained with oil red O (ORO). THP cells were treated with/without cyclophilin A (100 ng/mL) and oxidized LDL in both normal glucose (NG) and high glucose (HG) conditions for 24 h before staining with ORO. Abundant ORO positivity was seen in cells treated with oxLDL and cyclophilin A cultured in HG conditions. c Confocal images of Dil-oxLDL uptake in THP cells differentiated to macrophages in the presence of cyclophilin A (100 ng/mL). Dil-oxLDL uptake is shown in red. Cells were counterstained with Dapi (blue). Inset is the enlarged image of a foam cell showing red coloured lipid droplets. Acetylated LDL (Ac LDL) was taken as the positive control. Mean intensity was quantified using microscope imaging software NIS-Elements Viewer. Cells treated with ox LDL had extensive lipid uptake compared to control cells. d Flow cytometric analysis of Dil-OxLDL uptake by macrophages before and after treatment with cyclophilin A in high glucose conditions. Cells were treated with and without cyclophilin (100 ng/mL) for 24 h and then labeled with DiI Ox-LDL for 4 h. The fluorescence intensity was analyzed by FACS using FACS Diva v8.0 software. Cells were quantitated by subtracting the cell autofluorescence of the treated samples and expressed as mean fluorescence intensity
