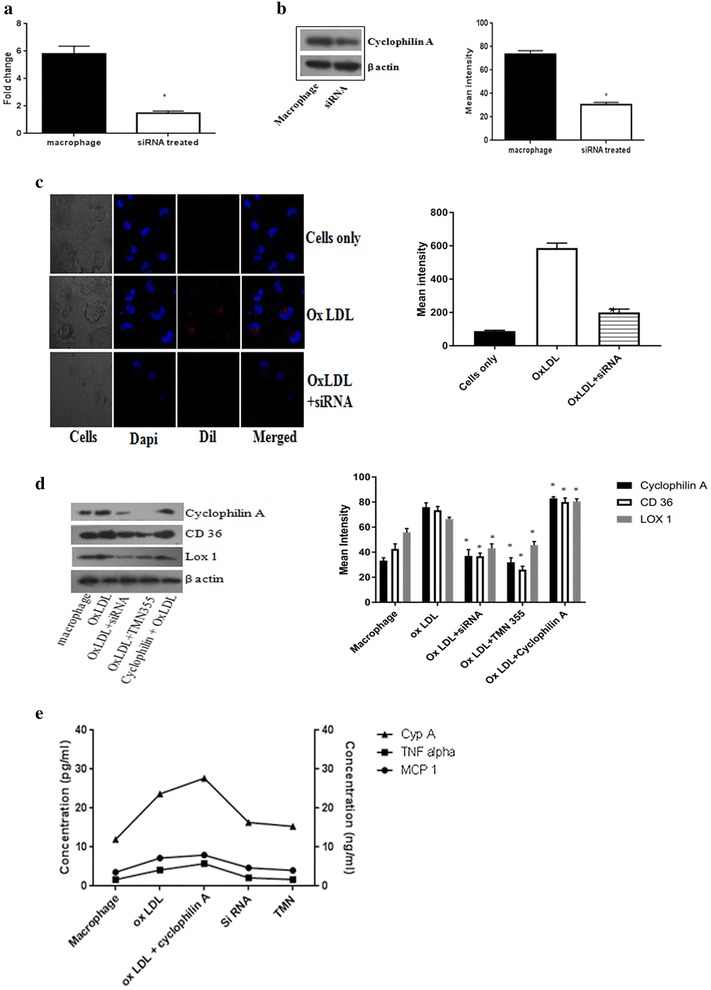
Fig. 4.

a Transfection efficiency was analyzed using real time PCR after treatment of THP differentiated macrophages with mission siRNA (7 pmol) for 48 h. b Immunoblotting image of cyclophilin A protein expression after treatment with mission siRNA to confirm transfection. β-actin was used as endogenous control. Protein densities of immunoreactive bands measured by the Quantity One 1D analysis software program. Data are presented as mean ± SD (n = 3) and asterisk represents p < 0.05). c Confocal images of foam cell formation after transient transfection of cyclophilin A using mission siRNA for 48 h. The transfected cells were treated with DiI conjugated oxLDL. Dapi was used as the nuclear stain. Mean intensity was quantified using microscope imaging software NIS-Elements Viewer, *p < 0.05 was considered significant. d Western blot analysis of cyclophilin A after treatment with mission siRNA. Expression of scavenger receptor markers CD36 and LOX-1 were also reduced after siRNA transfection of cyclophilin A. Protein densities of immunoreactive bands measured by the Quantity One 1D analysis software program. Data are presented as mean ± SD (n = 3) and asterisk represents p < 0.05. e ELISA analysis of conditioned medium after treatment with siRNA and chemical inhibitor of cyclophilin A, TMN 355. Levels of TNF-α (pg/mL), MCP 1 (pg/mL) and cyclophilin A (ng/mL)
