Fig. 1.

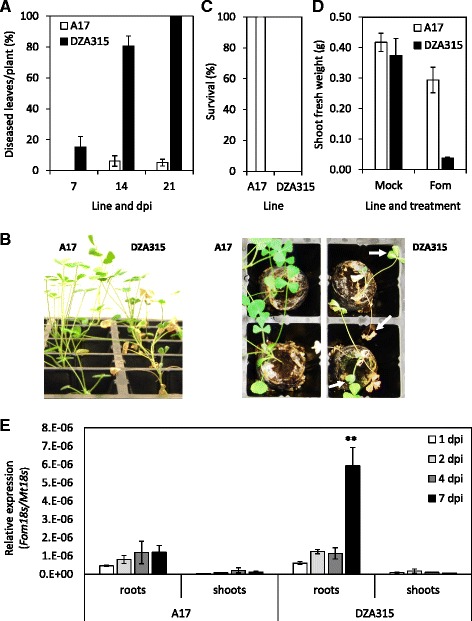
Disease symptoms and Fom colonisation of resistant and susceptible M. truncatula accessions. a-d Disease symptoms of Fom inoculated A17 and DZA315 M. truncatula seedlings. a Percentage of diseased seedlings at 7, 14 and 21 days post inoculation (dpi) with b) an image of representative seedlings at 14 dpi. White arrows highlight disease symptoms of wilting, chlorotic and necrotic leaves. c Average survival and d above ground fresh weight of mock (control) or Fom inoculated seedlings at 21 dpi. For a, c and d values are averages ± SE (n = 10). Similar results were obtained in independent experiments. e Relative Fom fungal abundance determined by qRT-PCR analysis of Fom_18S relative to M. truncatula_18S in samples harvested at 1, 2, 4 and 7 dpi. Samples are averages ± SE of 4 biological replicates consisting of pools of 10 seedlings. Asterisks indicate values that are significantly different (**P < 0.01 Student’s t-test) between A17 and DZA315 at the respective time point
