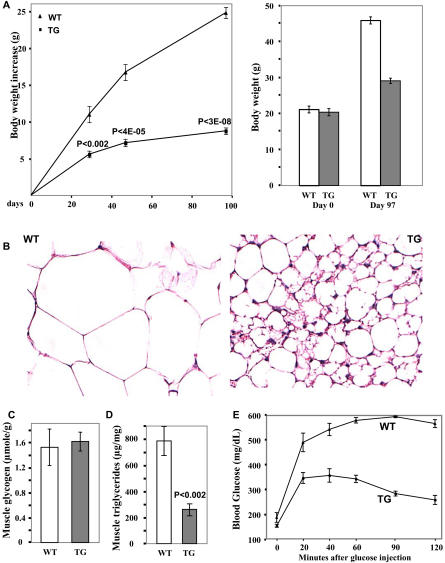
Figure 4. Resistance to High-Fat-Induced Obesity in the Transgenic Mice.
(A) Seven-week-old transgenic (TG) and wild-type (WT) littermates (n = 5–6 for each group) were fed with a high-fat diet for 97 d. Left panel shows net body weight gain, which was calculated for individual mice and then averaged. Right panel shows the body weights before (Day 0) and after (Day 97) high-fat feeding.
(B) Histology of inguinal fat pad in the transgenic and wild-type littermates under a high-fat diet for 2 mo.
(C and D) Intramuscular glycogen content (C) and triglyceride content (D) of mice in (A) after high-fat feeding (n = 6).
(E) Glucose tolerance test. Mice in (A) after high-fat feeding were fasted for 6 h and then injected with glucose at a concentration of 1g/kg body weight. Then blood glucose levels were measured periodically over 2 h (n = 6).

