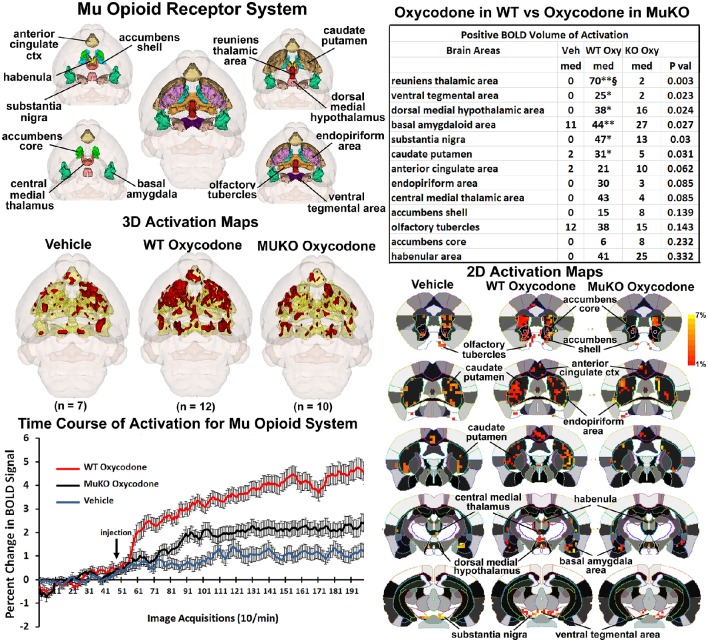
Figure 3.
Mu opioid receptor system. Shown in the top left are 3D colored volumes of 13 areas in the brain noted to have a high density of μ opioid binding sites. The central image is a coronal view of a translucent shell of the mouse brain showing the total composite and location of the different 3D volumes of interest. Surrounding this are different layers showing a clockwise, caudal (deepest, lower left) to dorsal perspective of the different brain volumes. The color-coded volumes are coalesced into a single volume shown in yellow below for each of the three experimental conditions. The number of animals contributing to the data for each experimental condition are shown in parentheses. Once fully registered and segmented, the statistical responses for each animal are averaged on a voxel-byvoxel bases. Those averaged voxels that are significantly different from baseline for positive BOLD are show in their appropriate spatial location coalesced as a 3D volume. Below on the right are 2D activation maps from the mouse brain atlas showing the precise location of the significantly altered positive (red) voxels following OXY for each experimental condition. These are the same 3D data but shown in a 2D perspective. The vertical color strip shows the scale of the positive BOLD signal change. The table in the upper right lists the 13 areas having a high density of μ opioid binding. The columns show the median (med) number of significant voxels for each brain area for each experimental condition. The voxel numbers for each condition were analyzed using a Newman-Keuls multiple comparisons test statistic followed by post-hoc analyses using a Wilcoxon rank-sum test for individual differences. All areas are ranked in order of their significance. There were no significant differences in the volume of activation between vehicle (Veh) and MuKO (KO Oxy) conditions. WT mice given OXY showed significance from Veh (*p <0.05, **p <0.01) and from MuKO conditions (§p <0.05). Shown in the lower left are time course data for the percent change in positive BOLD signal for each experimental condition. Each acquisition is the mean and SEM of the combined signal from the brains areas that were significantly different as reported in the table.

