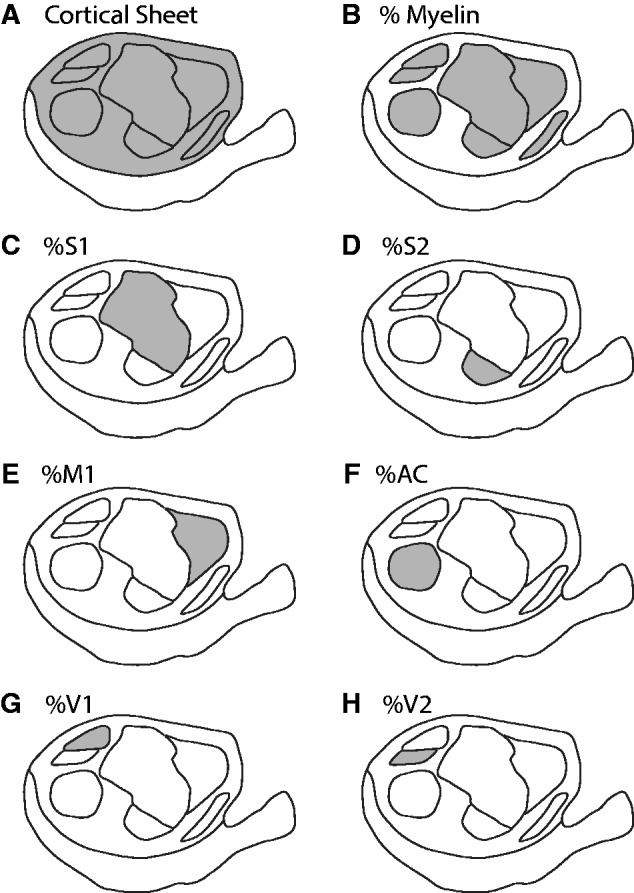
Figure 2.

Schematic identifying the cortical regions included in each calculation. In each case, the shaded area represents the region of interest. To determine the proportion of cortex, the area of each region was divided by the area of the cortical sheet. (A) The cortical sheet. (B) The total area of myelination. (C) Primary somatosensory cortex (S1). D) Second somatosensory cortex (S2). (E) Primary motor cortex (M1). (F) Auditory cortex (AC). (G) Primary visual cortex (V1). H) Second visual cortex (S2)
