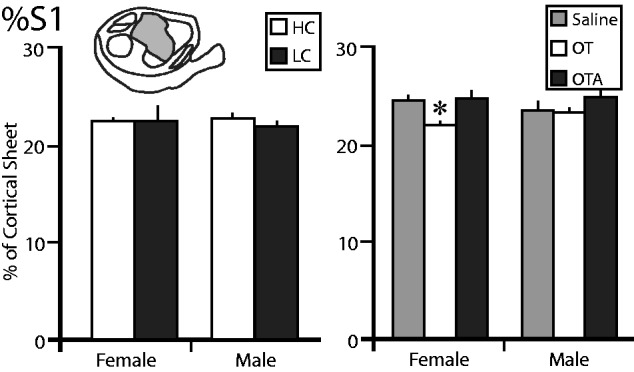
Figure 4.

The proportion of the cortical sheet occupied by the primary somatosensory cortex (%S1). The left graph shows the %S1 in female and male voles exposed to HC (white) or LC (black) amounts of parental care. There are no differences between any of these groups. The right graph shows the %S1 in female and male voles treated with saline (gray), OT (white), or OTA (black). The %S1 of females treated with OT was significantly lower than females treated with saline or OTA, or males treated with OT. *, significantly different from other group within the same sex
