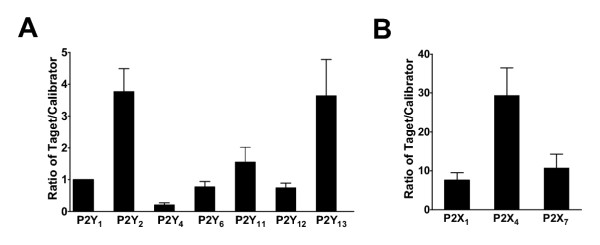
Figure 2.
Relative P2 gene expression in monocytes. A, Bar graph shows relative P2Y1, P2Y2, P2Y4, P2Y6, P2Y11, P2Y12 and P2Y13 receptor gene expression normalized to GAPDH. B, Bar graph shows relative P2X1, P2X4 and P2X7 receptor gene expression normalized to GAPDH. P2Y1 was chosen to be calibrator.

