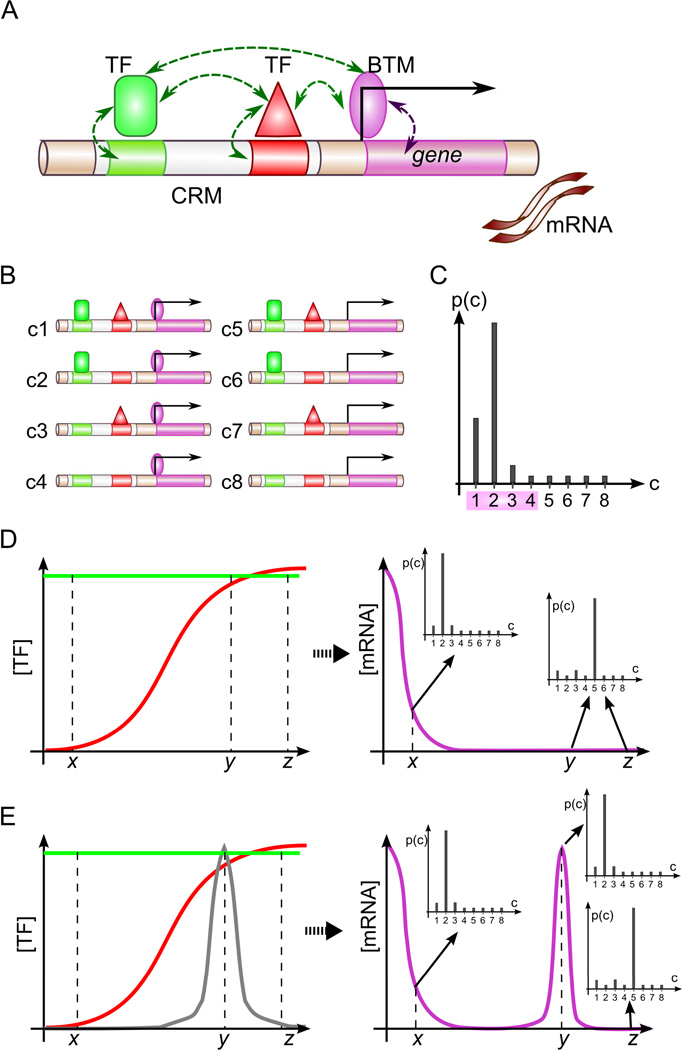
Figure 1.
Overview of GEMSTAT model. (A) GEMSTAT models the expression readout of an enhancer from the strength of TF-DNA and TF-BTM interactions in thermodynamic equilibrium and (B) considers all possible configurations of bound TFs and the BTM to compute the equilibrium probability of BTM occupancy at promoter (C). Shown is a hypothetical probability distribution for the configurations shown in B; probability of BTM occupancy is computed from configurations c1—c4. (D) GEMSTAT’s predictions change as TF concentrations change across different conditions. Shown is the profile of mRNA levels (magenta) resulting from a uniformly expressed activator (green) and a graded repressor (red); horizontal axis: different spatial locations. Also shown is how the equilibrium probability distributions change with changes in TF concentrations. (E) A molecular species (gray) that can attenuate the DNA-binding affinity of a repressor may increase the mRNA level of the gene shown in D.

